 GB
GBIT Infrastructure & Data Protection Expert
What is syslog and where did it come from?
Syslog (System Logging Protocol) is a method for transmitting vital system information to centralized collection systems. It enables administrators to monitor the status and health of their environments and applications effectively. Unlike SNMP, which has a more rigid framework, Syslog offers greater flexibility in monitoring a broader range of events and accommodating less predictable scenarios.
Syslog has a long history and was first introduced to the world in 1980 by Eric Allman as part of the Sendmail project. It soon gained popularity and has continued to maintain widespread appeal.
The original RFC 3164 was updated in 2001 with RFC 5424 which continues to be the standard in use today.
Veeam’s perspective
Starting with version 12.1, Veeam now supports sending syslog messages. This feature allows you to export Linux logs to a log collector, making it easier to view and analyze them.
What exactly is a syslog message and what does it look like?
A Syslog message, according to RFC 5424, has numerous fields and values:
- PRI (Priority): Combination of Facility and Severity
- VERSION: Protocol version number
- TIMESTAMP: Date and time of event
- HOSTNAME: Source host name
- APP-NAME: Name of the application generating the message
- PROCID: Process ID
- MSGID: Identifier for the type of message
- STRUCTURED-DATA: Key-value pairs providing additional context
- MSG: Free-form message text
However, it is important to note that not every field needs to be populated, as certain fields may remain empty or be omitted based on the specific context or logging system in use. This is what makes Syslog so attractive to developers.
Severity Levels
Syslog also features a range of severity levels, including:
0 Emergency (emerg): System is unusable
- Example: Complete system failure, kernel panic
1 Alert (alert): Action must be taken immediately
- Example: Database corruption, loss of system security
2 Critical (crit): Critical conditions
- Example: Hardware failure, application component unavailable
3 Error (err): Error conditions
- Example: Application errors, failed process operations
4 Warning (warning): Warning conditions
- Example: Resource nearing capacity, service degradation
5 Notice (notice): Normal but significant conditions
- Example: Service starts/stops, configuration changes
6 Informational (info) - Informational messages
- Example: Regular operation events, successful operations
7 Debug (debug): Debug-level messages
- Example: Detailed troubleshooting information, development logs[SB1]
Note: The visible message in the console may not contain these severity levels.
How a Syslog Message is Triggered
In this section, we explain how to trigger a Syslog message and check its receipt on a Syslog server. By running the command ‘sudo ls’ on the Linux server podman01, a Syslog alert is sent to the Syslog server s3tester01. We detail the information contained in the Syslog message, including the timestamp, hostname, process ID, and the action performed. ‘Sudo’ enables a regular user to temporarily execute specific commands with superuser (root) privileges, rather than opening a full root session. This means the user is restricted to running only one command at a time with elevated permissions, which helps maintain system security and triggers a security message. Additionally, we cover how to verify that the message was received on the Syslog server and show how to use the tail command to monitor live Syslog entries.
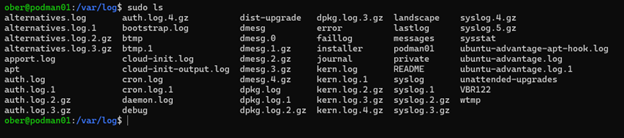
In the image below, we trigger a Syslog alert which is sent to a Syslog server. We use sudo to trigger a Syslog message on the server podman01 which is sent to the Syslog server s3tester01.
In the image below, the command ‘sudo ls’ is depicted.
On the S3tester01 Syslog server, we can see if the message was received:
‘tail -2 logs.txt’

The Linux server with hostname podman01 sends the following Syslog message indicating that the ‘sudo’ command was performed:
Jan 26 17:41:23 podman01 sudo[1435]: pam_unix(sudo:session): session opened for user root(uid=0) by ober(uid=1000)Jan 26 17:28:05 podman01 sshd[1097]: Server listening on :: port 22.
We can decipher this message as follows:
- Timestamp: Jan 26 17:41:23
- Hostname: podman01
- Process: sudo[1435]
- Message: pam_unix(sudo:session): session opened for user root(uid=0) by ober(uid=1000)
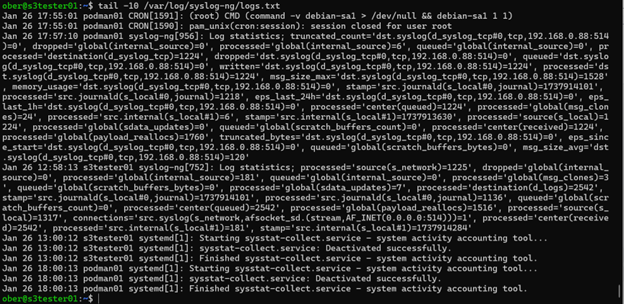
You can monitor live Syslog entries on the receiving Syslog server using the tail command. Since we’re directing incoming Syslog messages to a file named logs.txt, I would execute the following command to display the most recent 10 entries:
‘tail -10 /var/syslog-ng/logs.txt’
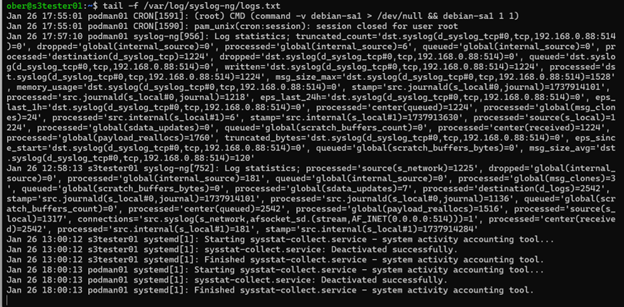
To watch the file in real time, I can use this command:
‘tail -f /var/syslog-ng/logs.txt’
How to turn on Syslog messages in Veeam
In this section, we will discuss how to enable Syslog message forwarding in Veeam, a feature introduced in version 12.1. By following the steps outlined, you can configure the system to send Syslog messages to your chosen server, ensuring effective monitoring of backup and replication activities.
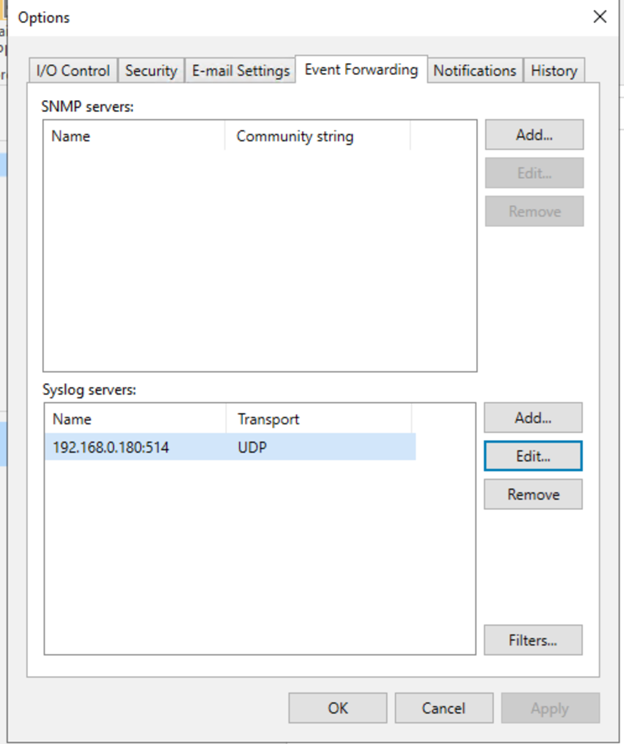
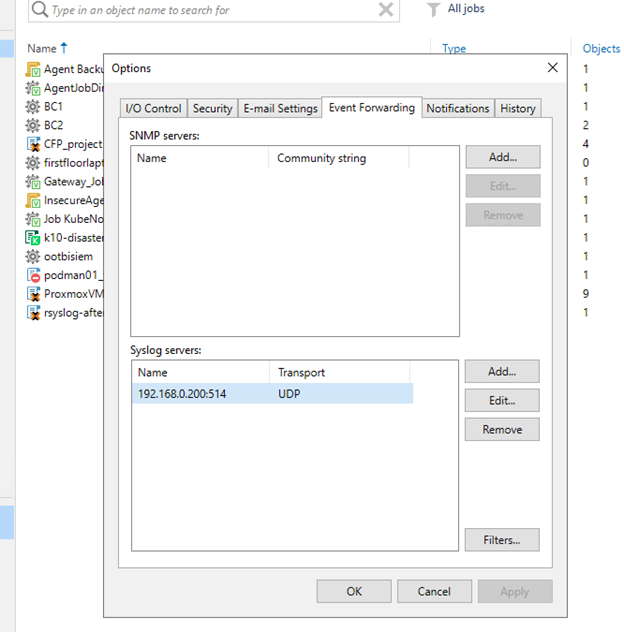
To turn on forwarding, open the “Options” window, then select the “Event Forwarding” tab as shown in the following image.
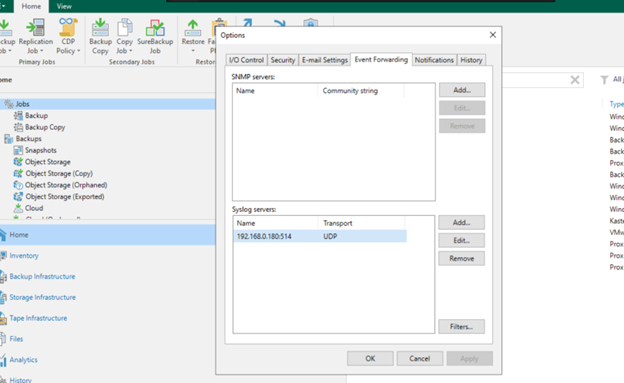
Within the “Syslog Servers” table, add your receiving server.
Note: You can only add one server.
You have a choice between UDP (User Datagram Protocol) , TCP (Transmission Control Protocol), or TLS (Transport Layer Security). To keep your Syslog messages confidential, leverage message encryption via TLS.
In this case, we will send our Syslog messages over UDP to a Syslog server at IP 192.168.0.180.
After clicking the “Apply” button, you will immediately see this message:
VBR (Veeam Backup & Replication) sends a test message to Syslog confirming that everything is functioning as expected.
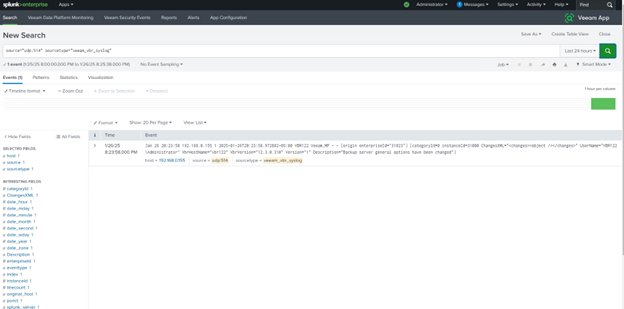
Then, you will receive a similar Syslog message from Veeam:
2025-01-26T12:24:37.035294-05:00 VBR122 Veeam_MP [categoryId=0 instanceId=40001 InstallationId="d465fd95-7e66-4956-b2d2-41938cce5f34" VbrHostName="vbr122" VbrVersion="12.3.0.310" Version="1" Description="Veeam Backup and Replication service is connected to configuration database: Server name: localhost:5432 Database name: VeeamBackup Authentication: Windows Installation ID: {d465fd95-7e66-4956-b2d2-41938cce5f34}"]
SIEM
Sending and receiving Syslog messages is beneficial, but it's impractical to expect anyone to monitor a command line continuously. To maximize the advantages of this setup, we should utilize a Security Information and Event Management (SIEM) system .
A SIEM effectively gathers, analyzes, and correlates data from various sources, enabling it to detect and respond to security threats. There are numerous SIEM solutions available, both open-source and proprietary, to fit different needs.
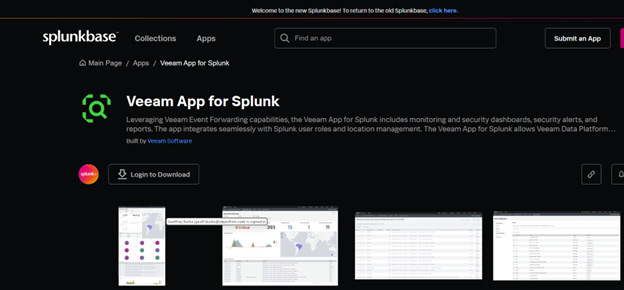
One notable challenge when integrating Syslog messages with a SIEM is the need to configure alerts and settings tailored to your specific application. However, if you choose Splunk as your SIEM, the Veeam APP can significantly simplify this process.
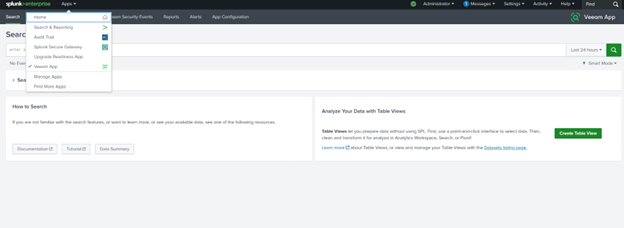
To install the Veeam APP for Splunk, log in to your Splunk account and download it from the APPs page.
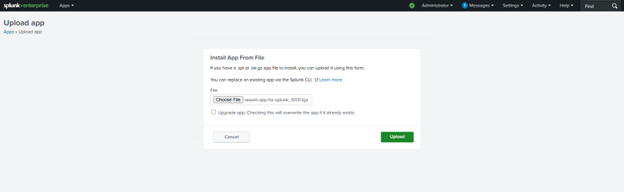
Next, upload the .tgz file in the “Manage Apps” section of the Splunk Web UI by clicking the “Install App from File” button.
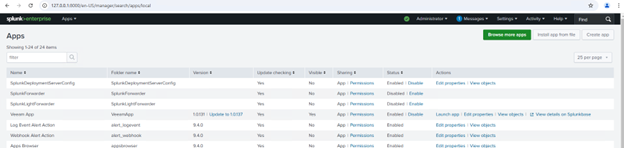
Then, choose your file and click the “Upload” button.
Once the app is installed, Splunk will prompt you to restart the services. After logging in, you will find the new Veeam app ready for use.
In Veeam, we need to configure Syslog event forwarding to direct data to our Splunk server.
This will generate the first message in Splunk.
We've only begun to explore the essentials of Syslog and SIEMs, but I believe this serves as an excellent foundation for everyone to begin setting up Syslog messaging.
Keep in mind, you can't address issues if you're unaware of their existence.