 GB
GBIT Infrastructure & Data Protection Expert
SIEM & Monitoring Blog Series: ELK Stack
In this second installment of our ELK Stack mini-series within the broader SIEM & Monitoring Blog Series, we shift from foundational concepts to hands-on implementation. This post walks you through setting up a functional ELK test environment using Docker on an Ubuntu virtual machine, giving you a sandbox to explore how Elasticsearch, Logstash, and Kibana work together to process and visualize data.
Whether you’re a backup administrator or an IT professional, this guide offers a customizable lab where you can experiment with parsing Veeam Backup & Replication Syslog messages and forwarding them into your ELK stack. The goal is to provide a safe, flexible environment for learning and testing, not production deployment.
Docker Setup
Requirements: You will need an Ubuntu server VM.
1. First, we will install docker:
sudo apt install docker.io
sudo apt install docker-compose -y
sudo usermod -aG docker $USER
2. Logout and log back in, or do one of these commands:
source ~/.bashrc
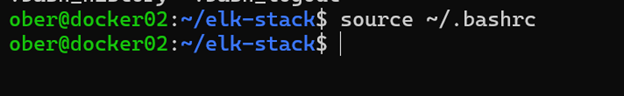
exec bash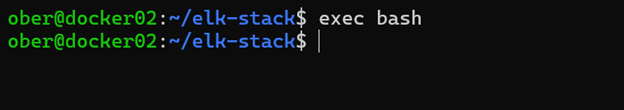
3. Log out and log back in to verify that Docker was installed successfully.
docker --version
docker compose version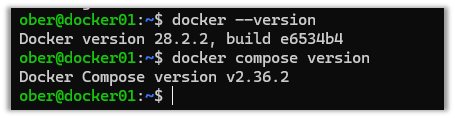
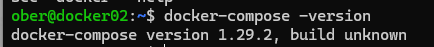
4. Depending on version, the Docker Compose command might appear like this:
5. Clone this GitHub repository: https://github.com/object1st/elk-stack.git
git clone https://github.com/object1st/elk-stack.git6. Cd into the folder.
cd elk-stack/7. Run this command:
docker-compose up -d8. The containers will be pulled down and then started.
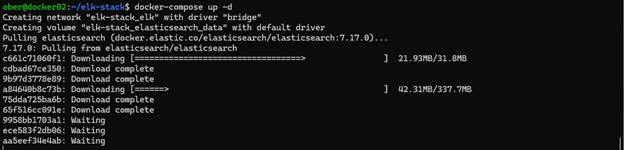
9. Check that either of the following containers are running:
docker ps
docker-compose ps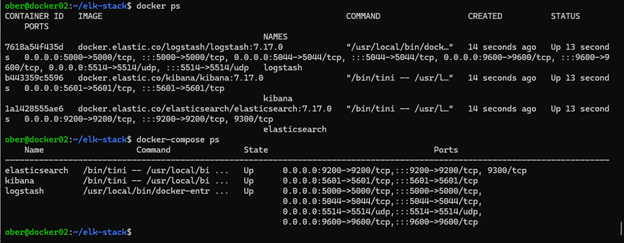
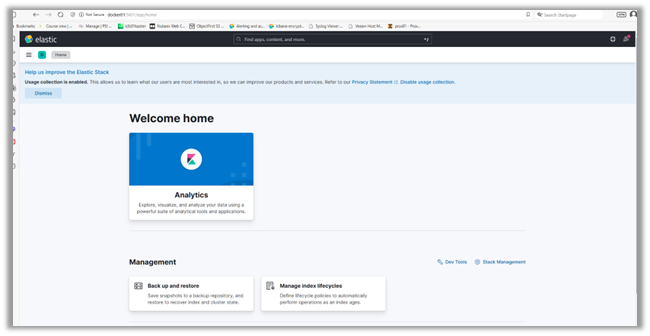
Accessing Kibana in Your Browser
Now that everything is set up, you can open Kibana in your browser. By default, Kibana runs on port 5601, so you’ll need to navigate to the appropriate URL based on where your Docker environment is hosted.
For example, if your Docker setup is running on a VM named docker01, you would go to:
If your VM has a custom DNS name like geoffsvm, then the URL would be: http://geoffsvm:5601
Alternatively, if you don’t have a DNS name configured, you can use the VM’s IP address instead:
http://[your-vm-ip]:5601:5601
Ultimately, just make sure you're pointing to the correct host and using port 5601, which is the default for Kibana.
Note: If at any time you want to start fresh, then perform the following steps to erase the setup:
To remove all containers, networks and volumes perform the following commands:
docker compose down --volumes --remove-orphans
docker system prune -a --volumes -f
Configuring Veeam VBR to Send Syslog Data to ELK
To ingest logs into our setup to see how it is working, we will configure Veeam VBR to forward its syslog messages to ELK:
1. Go to the upper left-hand drop-down menu and click on “Options.”
2. Then click on the “Event Forwarding Tab.”
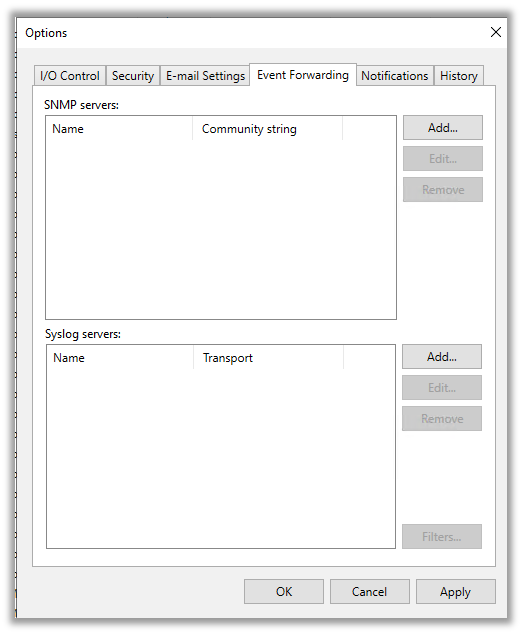
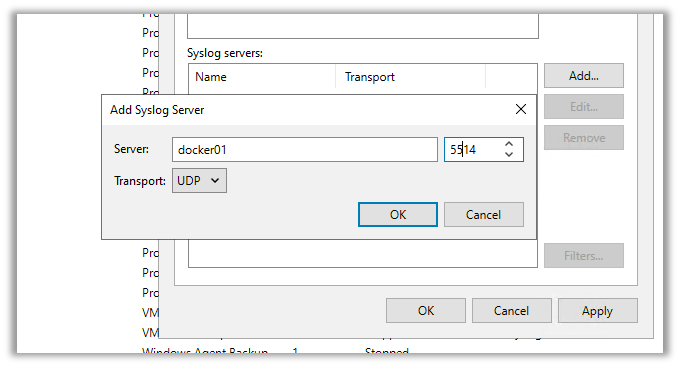
3. Here, we will add the syslog server that we created in Docker. Click on “Add” and type in the details. Then, click on either:
- “Apply” to save and close the window.
- “OK” to save and keep the window open.
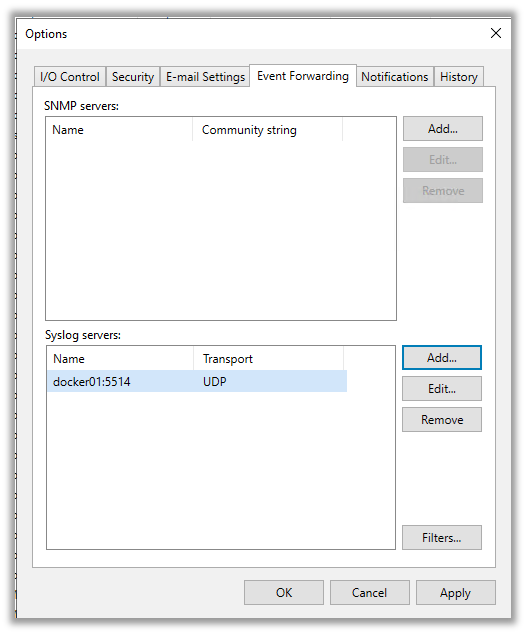
Once you press apply or ok, Veeam will send its first test syslog message to Elasticsearch.
Verify Log Discovery in Kibana
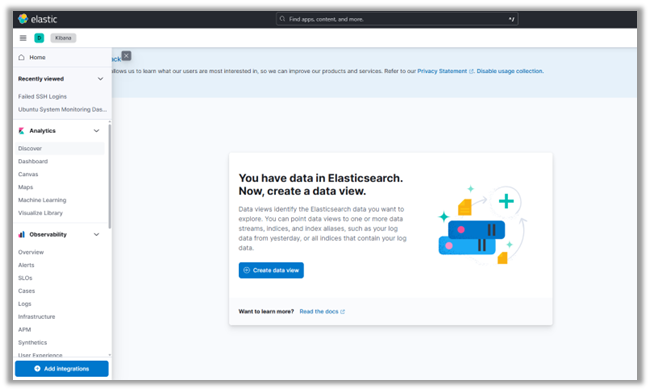
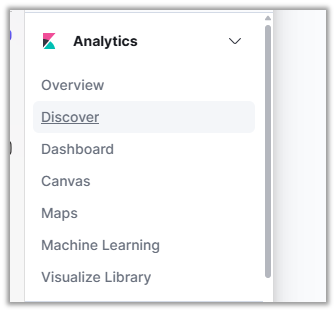
1. Navigate back to the Kibana interface.
2. In the upper left drop-down menu, click on “Discover.” There you will be presented with an invitation to create a new Index Pattern, including a view of the syslog data by field:
3. Click on “Create Index Pattern.”
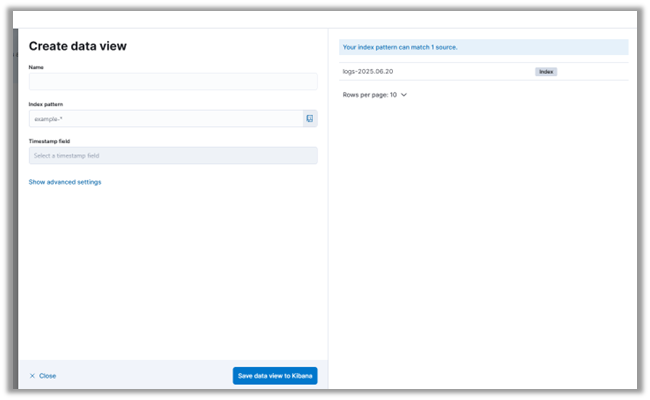
4. You can see that our Elasticsearch server has already received some syslog messages from Veeam. When you configure the syslog server settings in Veeam, it automatically sends a test message. This allows you to verify that your monitoring or SIEM system is receiving the logs correctly.
5. We'll name our Index Pattern Veeam_Logs and use an Index Pattern that matches the logs already ingested.
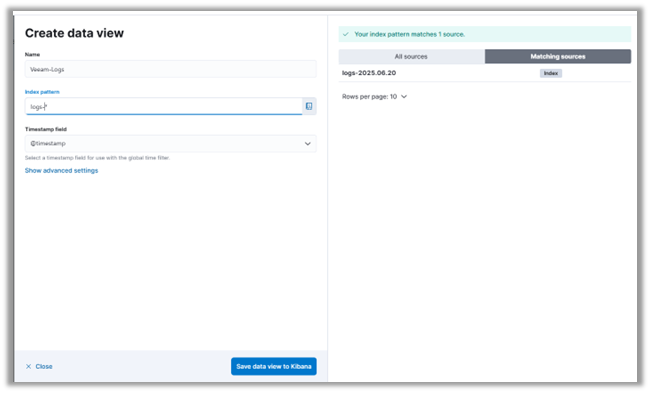
6. Click on “Save Index Pattern to Kibana.”
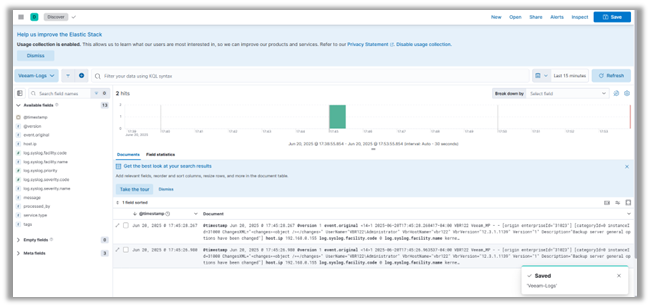
7. Press "Discover" in the menu on the left-hand side of the page to see the log messages from VBR.
Conclusion
With your ELK lab up and running, you've taken a major step toward building a functional SIEM environment. In this post, we walked through setting up Docker containers for Elasticsearch, Logstash, and Kibana, configured a Logstash pipeline for Veeam syslog messages, and explored those logs in Kibana. You now have a solid foundation for ingesting and visualizing log data in a controlled test environment.
In the next post of the mini-series, we’ll build on this foundation by diving into Elastic Security and exploring how it enhances threat detection and alerting within the ELK ecosystem. We’ll also introduce Fluentd as an alternative to Logstash, comparing the two tools and showing how to configure Fluentd to forward logs to Elasticsearch. If you're interested in security monitoring use cases, dashboard creation, and optimizing your log pipeline, you won’t want to miss out on what’s next.