 GB
GBIT Infrastructure & Data Protection Expert
The EFK Stack
We have already looked over the ELK stack but as promised at the start of the series we wanted to also present you with an alternative to Logstash. Fluentd is more lightweight and some administrators prefer it.
As with our previous blogs, you can set up a working playground by cloning our Git repository and follow the instructions.
Why EFK for Security?
The EFK stack offers several advantages for security monitoring. As we mentioned before, Elasticsearch provides fast search capabilities across massive datasets, making it ideal for analyzing security logs from multiple sources. Fluentd, much like Logstash in our previous examples, acts as a unified logging layer that can parse, transform, and route log data from various sources into Elasticsearch. Kibana serves as the visualization frontend, while Elastic Security adds dedicated SIEM capabilities including threat hunting, case management, and automated detection rules.
In the next couple sections, we’ll discuss the main differences between Fluentd and Logstash.
Architecture and Performance
Logstash is built in Java/JRuby and tends to be more resource-intensive, with higher memory usage but excellent processing throughput. It uses a pipeline-based architecture with input → filter → output stages that's particularly well-suited for complex transformations.
Fluentd is written in Ruby with performance-critical parts in C, making it lighter on memory usage and more efficient for high-volume log streaming. It uses a tag-based routing system that can be more flexible for complex log routing scenarios.
Syslog Parsing Capabilities
Logstash excels at syslog parsing with:
- Rich built-in syslog input plugins that handle various RFC formats (RFC3164, RFC5424)
- Powerful grok patterns for custom parsing
- Strong regex support for complex message extraction
- Excellent handling of structured data within syslog messages
Fluentd offers:
- Good syslog support through plugins like fluent-plugin-syslog
- More lightweight parsing that's efficient for high-throughput scenarios
- Better suited for scenarios where you need to preserve original message structure
- Simpler configuration for basic syslog ingestion
Configuration and Ease of Use
Logstash uses a domain-specific language that's intuitive for pipeline-based thinking but can become complex for intricate processing rules. The configuration is very expressive for data transformation.
Fluentd uses a more straightforward configuration format that many find easier to understand and maintain, especially for routing-heavy scenarios.
Ecosystem and Plugins
Logstash has a mature ecosystem with extensive filter plugins specifically designed for log processing and enrichment. It integrates seamlessly with the broader Elastic Stack.
Fluentd has a large plugin ecosystem and is more vendor-neutral, making it easier to integrate with various backends beyond Elasticsearch.
Memory and Resource Usage
For syslog processing specifically, Fluentd typically uses less memory and has a smaller footprint, which can be crucial in resource-constrained environments or when processing very high volumes of syslog data.
Logstash requires more resources but provides more processing power for complex transformations and filtering.
Reliability and Data Durability
Both handle syslog reliably, but Fluentd has built-in buffering and retry mechanisms that some find more robust for ensuring data delivery. Logstash requires additional configuration for similar reliability guarantees.
Which one should I choose?
If you're already invested in the Elastic ecosystem and require advanced data transformation capabilities, Logstash is a strong choice. For those prioritizing resource efficiency and simpler configuration—especially for syslog ingestion—Fluentd may be the better fit.
Hands on with EFK
Configuring Elastic Security
Elastic Security is the foundation of Elastic’s SIEM capabilities. In the next section, we’ll use our EFK Docker Stack playground to explore it in practice.
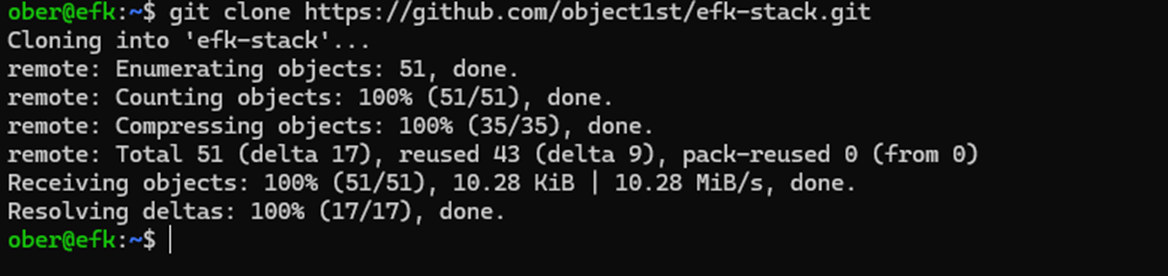
1. Clone the Git repository: https://github.com/object1st/efk-stack.git
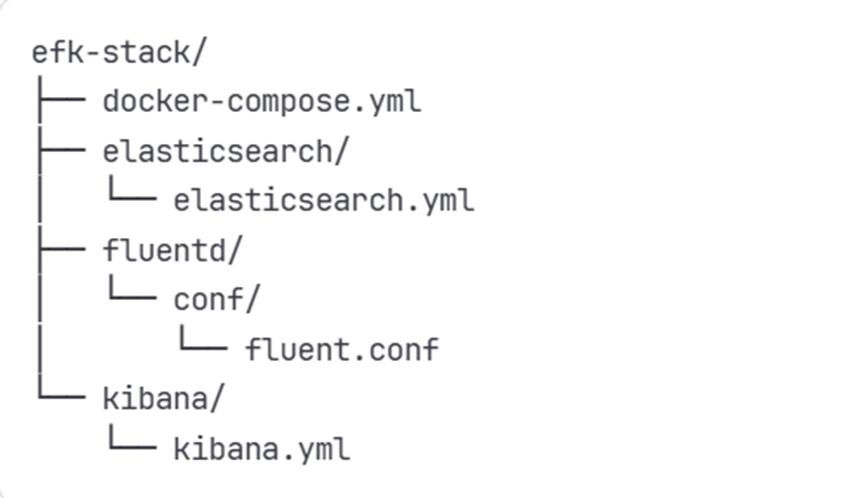
Note: The repository is organized as shown below. Later in the setup process, you'll need to add the passwords you create to the fluentd.conf and kibana.yml configuration files.
2. Ensure that you have installed docker and docker compose in your test Ubuntu VM.Check our previous blog for instructions on this process.
3. Change into the directory.
cd efk-stack 4. Run this command to bring up the environment:
docker compose up -d5. Check to see all containers are running:
docker ps6. Check to make sure services are running without errors in the containers:
docker logs elasticseach
docker logs kibana
docker logs fluentd
Note: For Kibana and Fluentd, you will see an error as we have not yet set up security.
Configuring Passwords and Security Integration
Step 1: Set Up Passwords for Elasticsearch
1. To begin, you'll need to create passwords for the built-in users in Elasticsearch. Run the following command:
docker exec -it elasticsearch bin/elasticsearch-setup-passwords interactive 2. This will prompt you to set passwords for several users. You only need to remember the passwords for the following two users:
- elastic
- kibana_system
3. For the other users, you can enter any password—they won’t be needed for this tutorial.
Step 2: Add Passwords to Configuration Files
1. Once you've created the passwords, add them to your Kibana configuration file:
File: kibana.yaml
2. Update or add the following lines with the passwords you set:
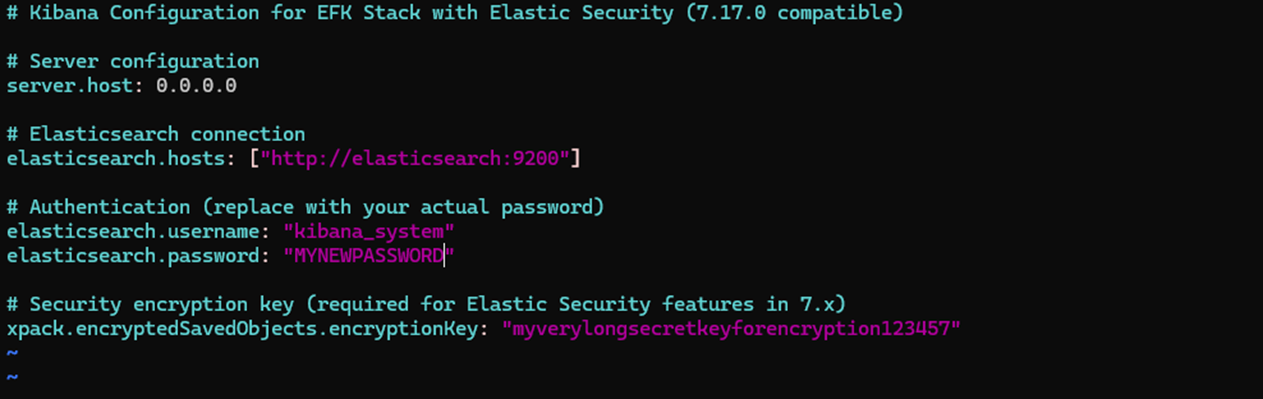
3. Make sure to replace it with the actual password you created.
Step 3: Restart Kibana Containers
After updating the kibana.yaml file with the correct password, restart the Kibana container to apply the changes:
docker compose restart kibanaStep 4: Update Fluentd Configuration
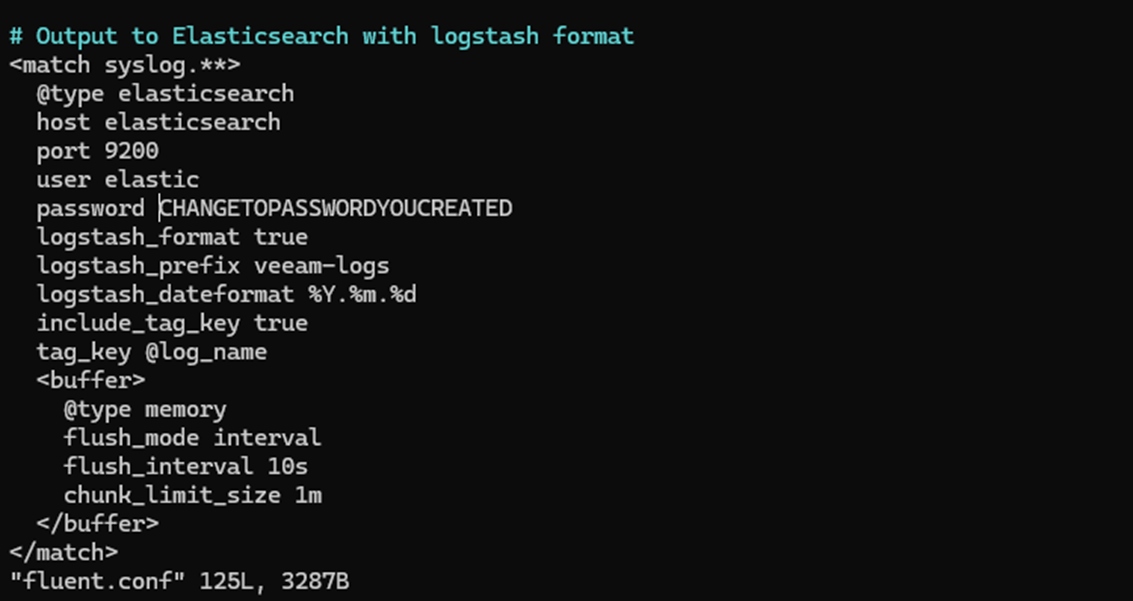
Next, update your fluentd.conf file to include the Elasticsearch password you created earlier. This ensures Fluentd can authenticate properly when sending logs to Elasticsearch.
Note: Make sure the password is securely stored and not exposed in version control.
Step 5: Restart Fluentd
Once you've updated the configuration, restart the Fluentd container:
docker compose restart fluentd Step 6: Verify Container Status
To confirm that both Kibana and Fluentd are running correctly, check their logs:
Fluentd Logs:
docker logs fluentd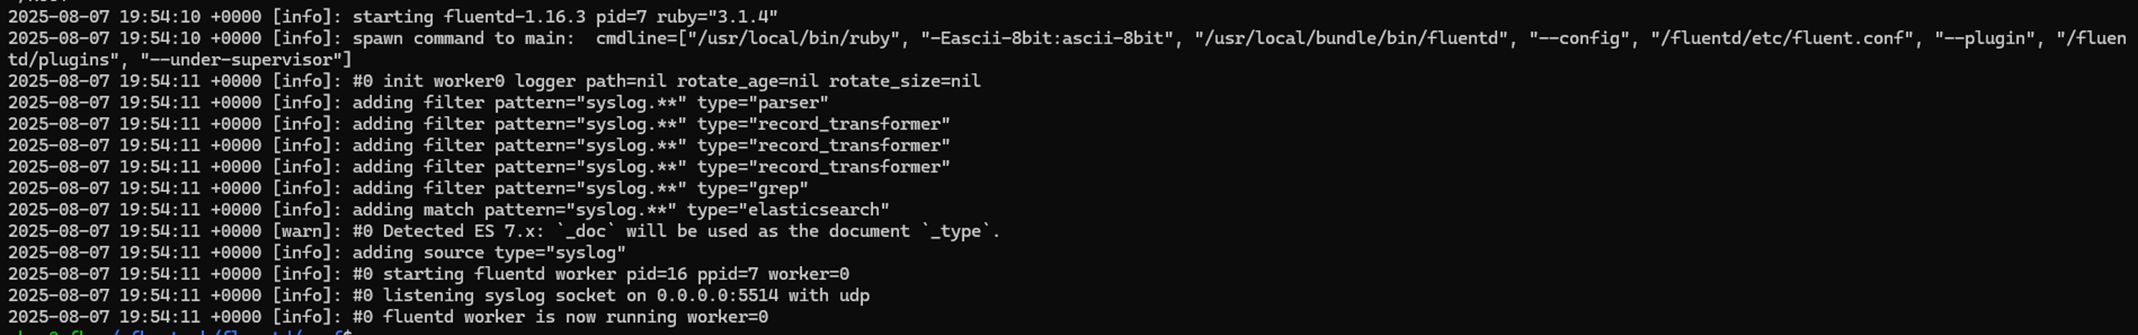
Kibana Logs:
docker logs kibana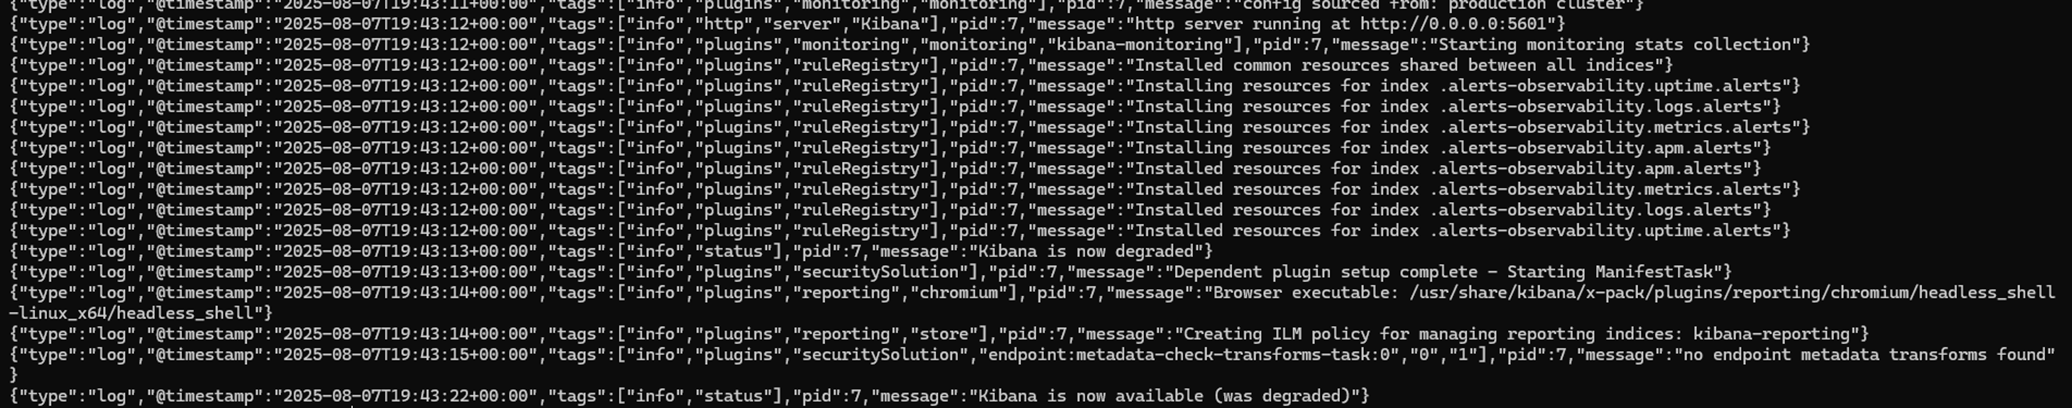
Look for any errors or warnings that might indicate issues with authentication or connectivity.
Step 7: Access Kibana
1. You will be greeted by the following login screen:
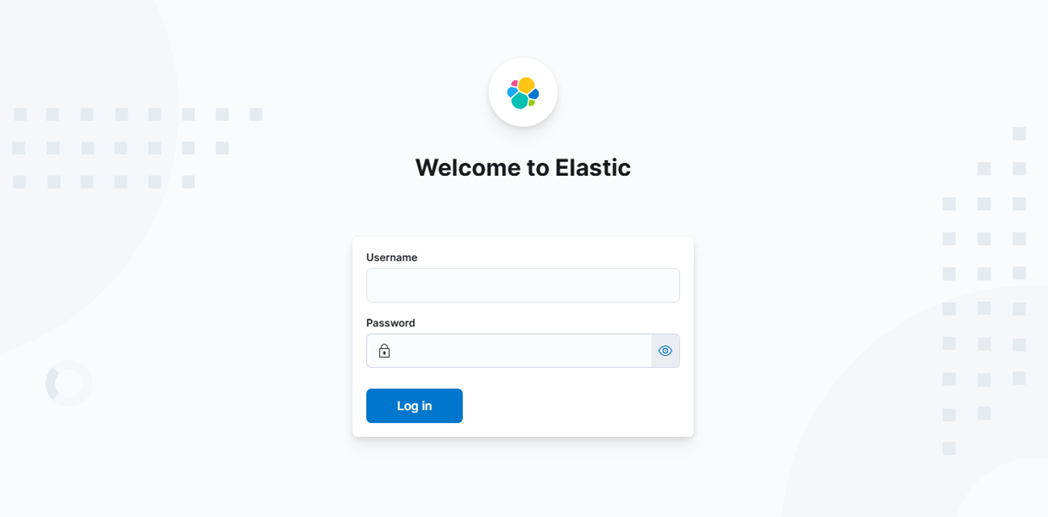
2. Log in using the password that you created for the Elastic user.
Ingesting a Test Syslog Message into Fluentd
To test your setup, you'll send a sample syslog message into Fluentd, which will parse and forward it to Elasticsearch. Kibana will then allow you to visualize the data and create alerts using Elastic Security.
Step 1: Create an Index Template
Before sending data, you need to define an index template that matches the structure of the logs Fluentd will send.
- Navigate to the Examples folder in your cloned repository.
- Open the file named create_index_template.txt.
- Replace the placeholder password with your actual Elastic password.
- Copy the entire contents of the file.
- Paste it into your terminal and press “Enter” to run the command.
- If successful, you should see a response like:
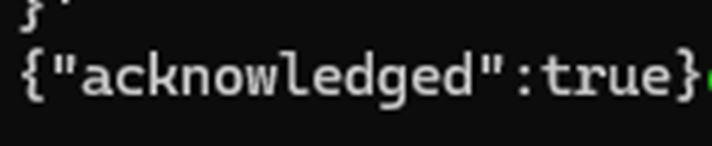
This confirms that the index template has been created and is ready to receive data.
Step 2: Send a Test Veeam Syslog Message
Run the following command in your terminal to simulate a Veeam ransomware alert:
echo '<14>1 2025-03-20T14:06:09.662307+02:00 VBRSRV01 Veeam_MP - - [origin enterpriseId="31023"] [categoryId=0 instanceId=41600 DetectionTimeUTC="03/20/2025 13:05:41" OibID="0e54d3bf-add8-48eb-9122-fad3ac1e8fb3" ActivityType="EncryptedData" UserName="TECH\user1" ObjectName="VM01" VbrHostName="vbrsrv01.tech.local" Description="Potential malware activity detected"]' | nc -u -q0 localhost 5514This message will be picked up by Fluentd, parsed, and sent to Elasticsearch.
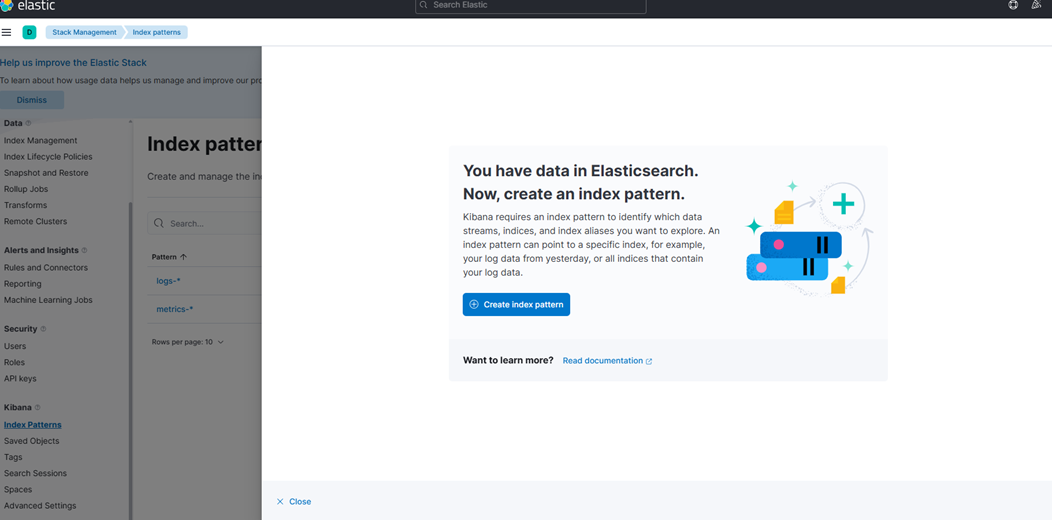
Step 3: Create an Index Pattern in Kibana
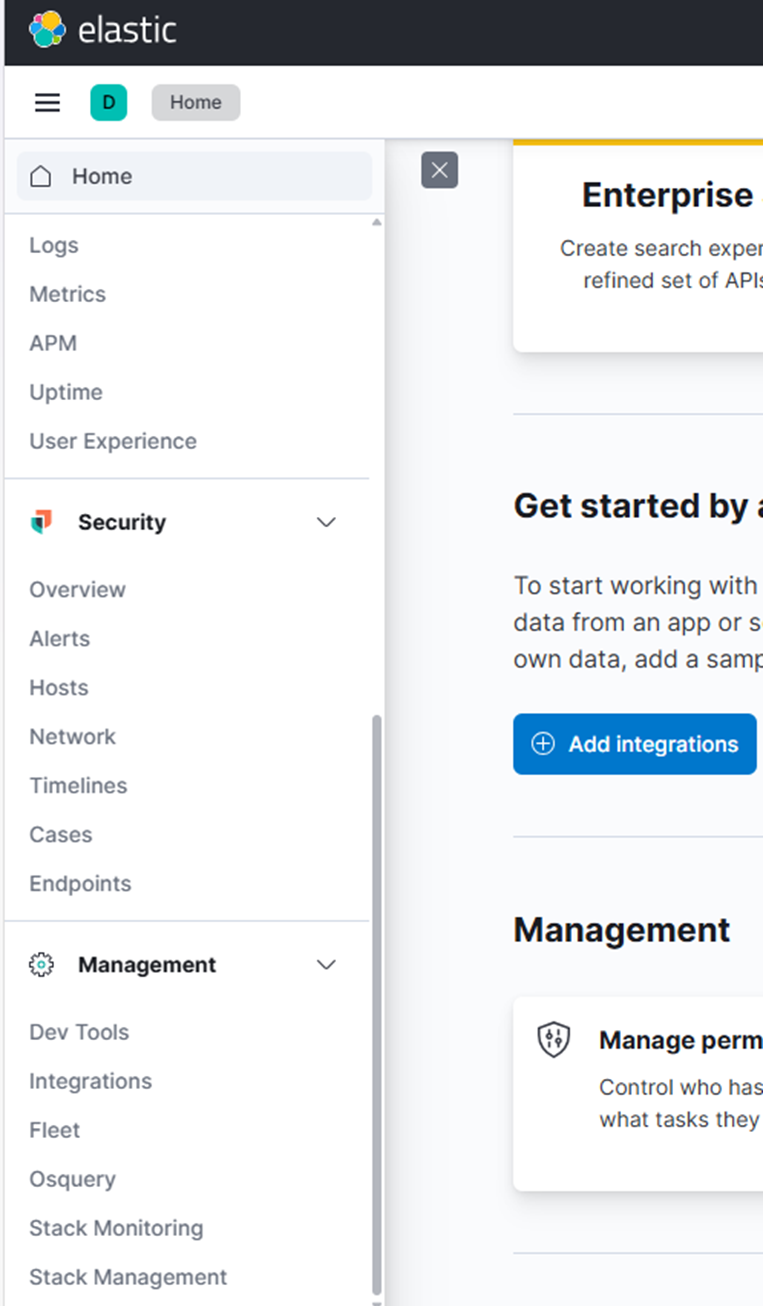
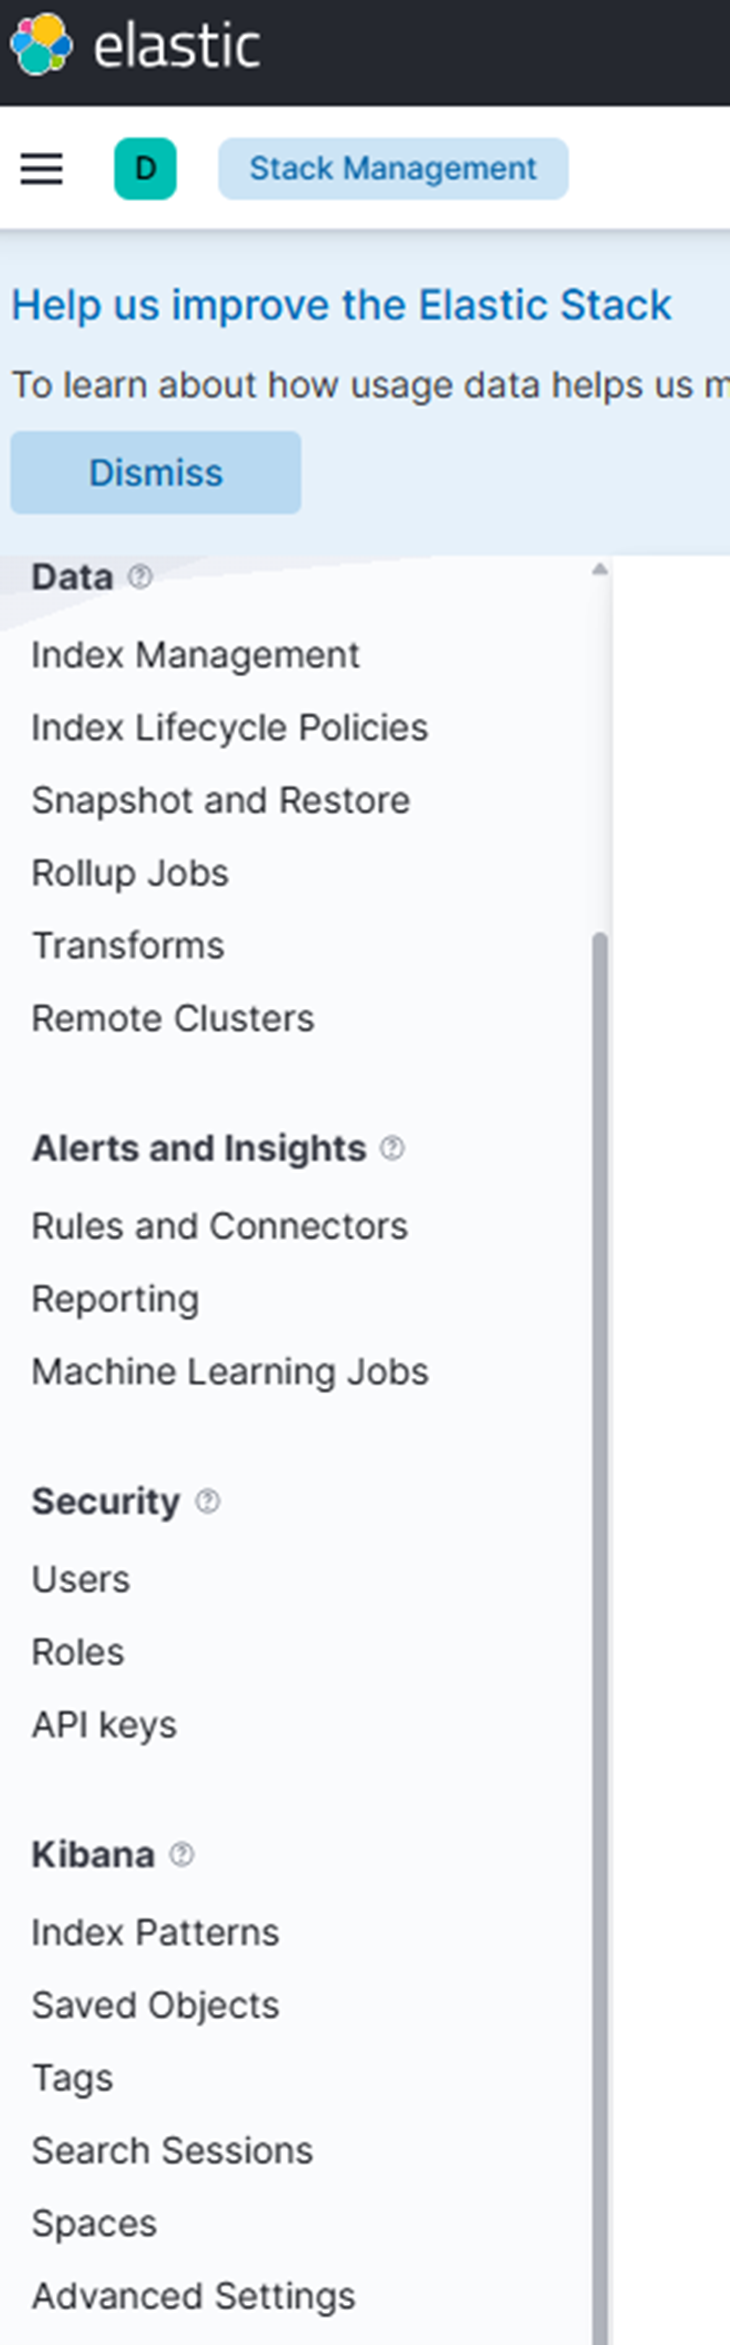
1. In Kibana, go to Stack Management → Index Patterns.
2. Click “Create index pattern.”
3. In the Index pattern name field, enter:
veeam-logs-*4. Select the appropriate timestamp field from the dropdown.
5. Click “Create index pattern.”
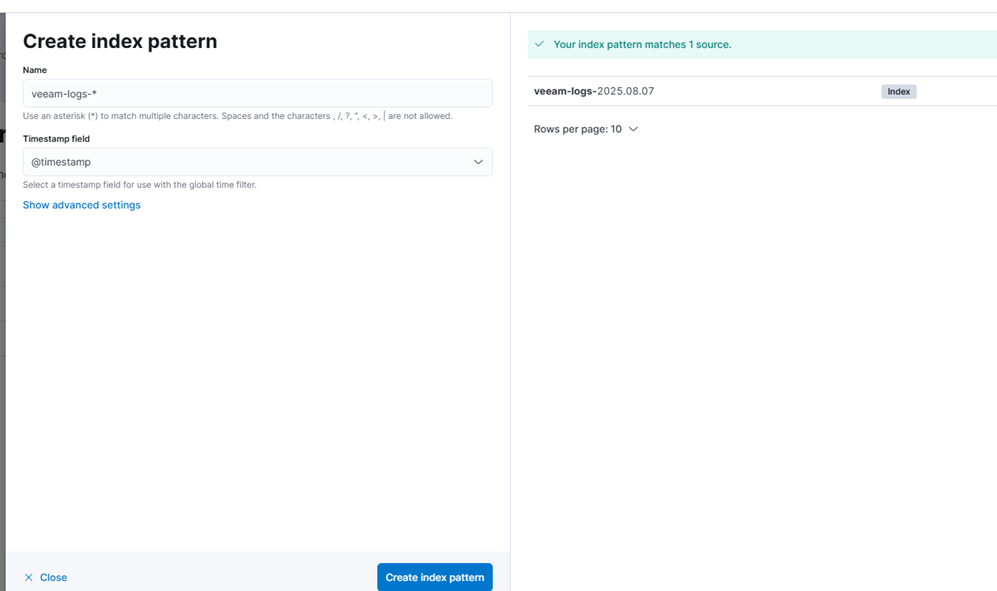
You should now see data from the test message you just sent.
Building Detection Rules in Elastic Security
With data flowing into Elasticsearch, you can now create detection rules to identify suspicious activity.
Step 1: Create an API Key for Detection Rules
Run the following command to generate an API key for Elastic Security:
curl -u elastic:Yourelasticpassword -X POST "localhost:9200/_security/api_key" \

-H "Content-Type: application/json" \

-d'{

  "name": "kibana-detection-rules",

  "role_descriptors": {

    "kibana_security": {

      "cluster": ["manage_security", "monitor"],

      "indices": [

        {

          "names": ["*"],

          "privileges": ["read", "write", "create_index", "view_index_metadata"]

        }

      ]

    }

  }

}'
Step 2: Initialize the Detection Engine
Run this command to initialize the detection engine in Kibana:
curl -u elastic:YOURELASTICPASSWORD -X POST "localhost:5601/api/detection_engine/index" -H 'Content-Type: application/json' -H 'kbn-xsrf: true'Step 3: Create a Custom Detection Rule
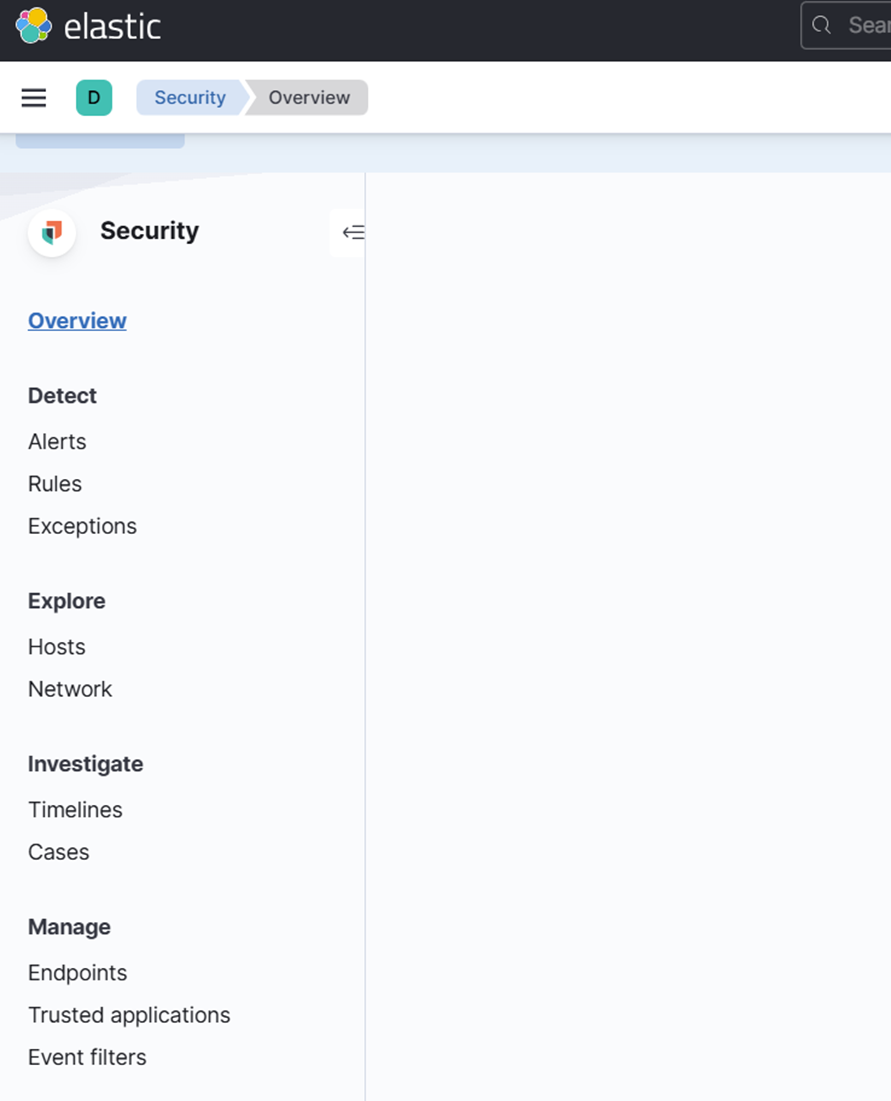
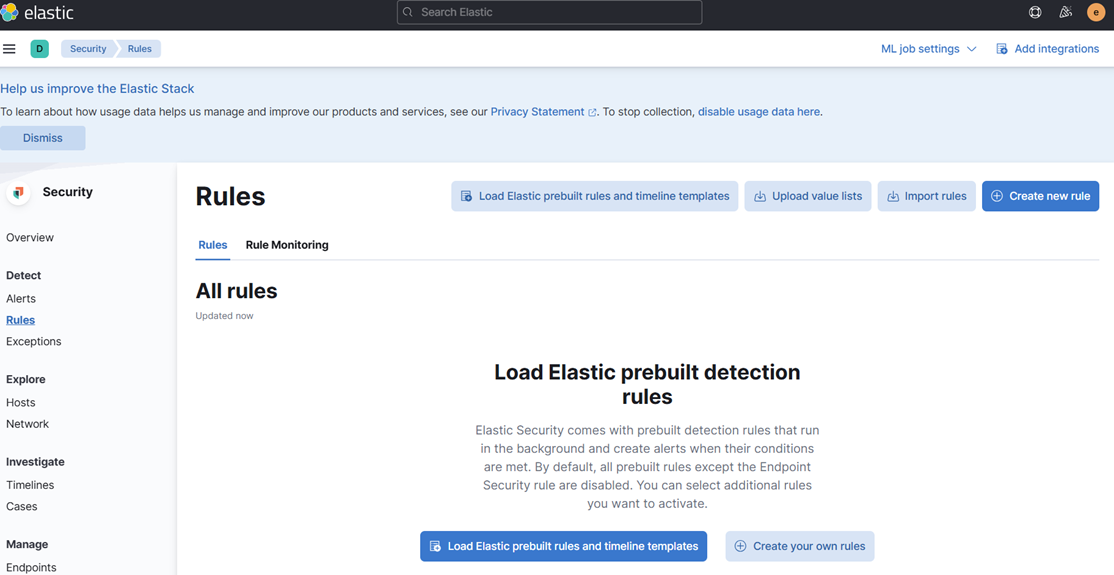
1. In Kibana, go to Security → Rules.
2. Click “Create new rule.”
3. Choose “Custom query.”
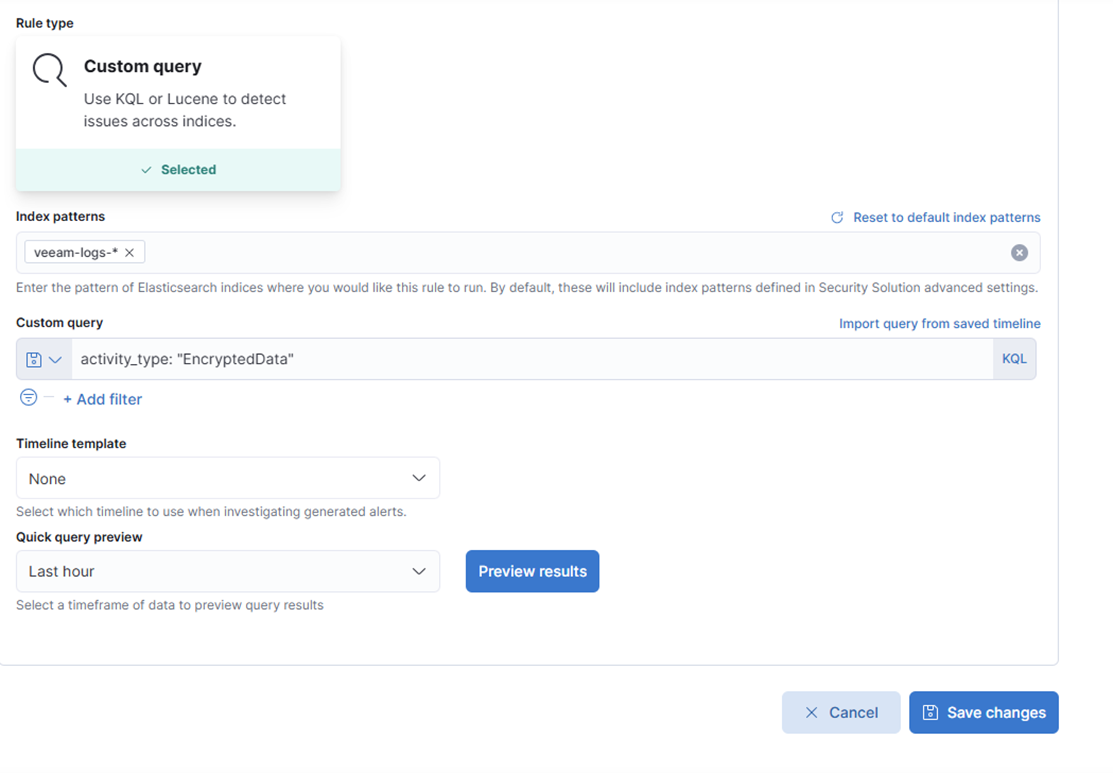
4. Under Index patterns, remove the defaults and add:
veeam-logs-*5. In the Custom query field, enter:
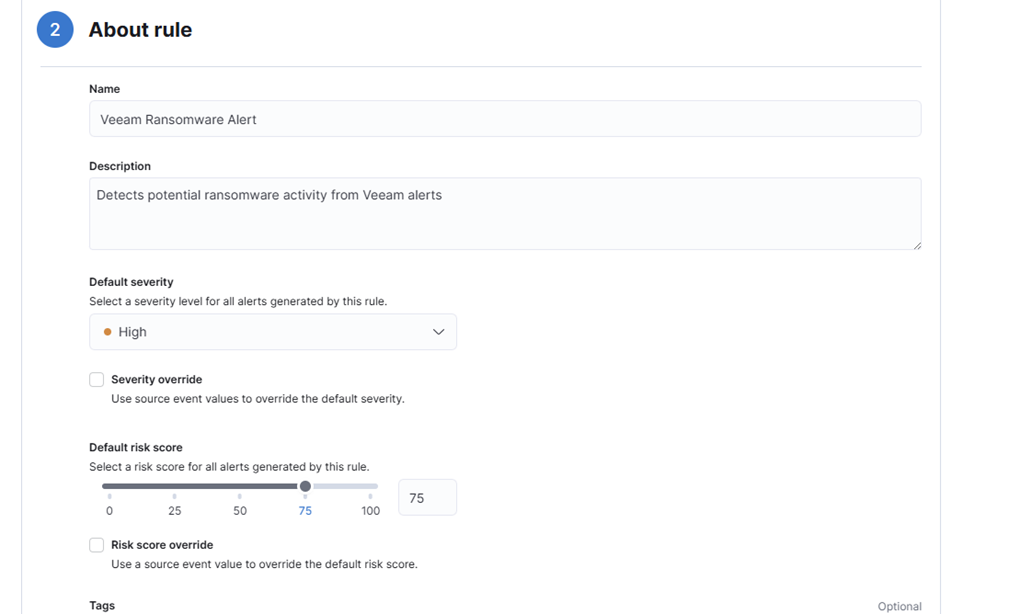
activity_type: "EncryptedData"6. Fill in the rule details:
- Name: Veeam Ransomware Alert
- Description: Detects potential ransomware activity from Veeam alerts
- Severity: High
- Risk Score: 75
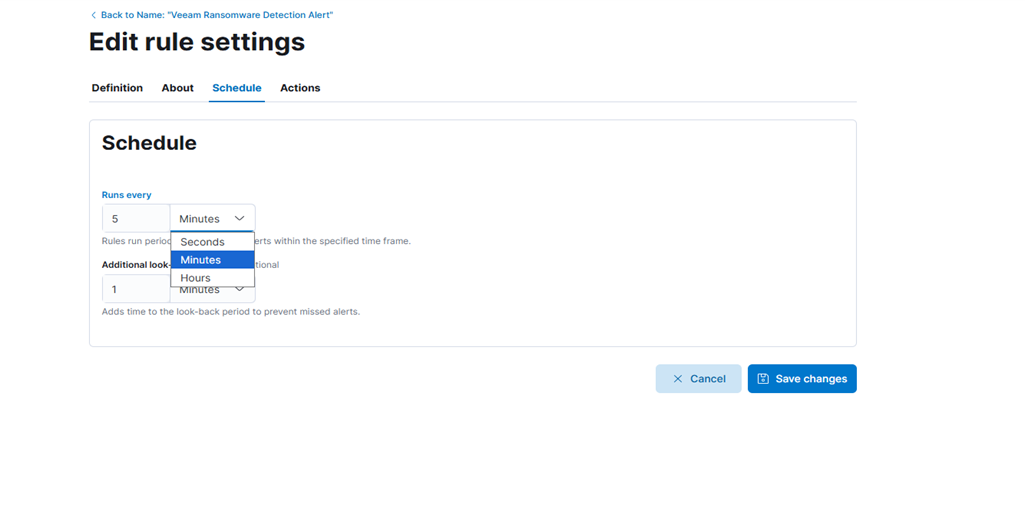
7. Click “Continue” and configure the schedule:
- For initial testing, consider setting a short schedule interval—such as every 20 seconds—to quickly verify that alerts are being triggered as expected. You can adjust this interval later based on your operational needs.
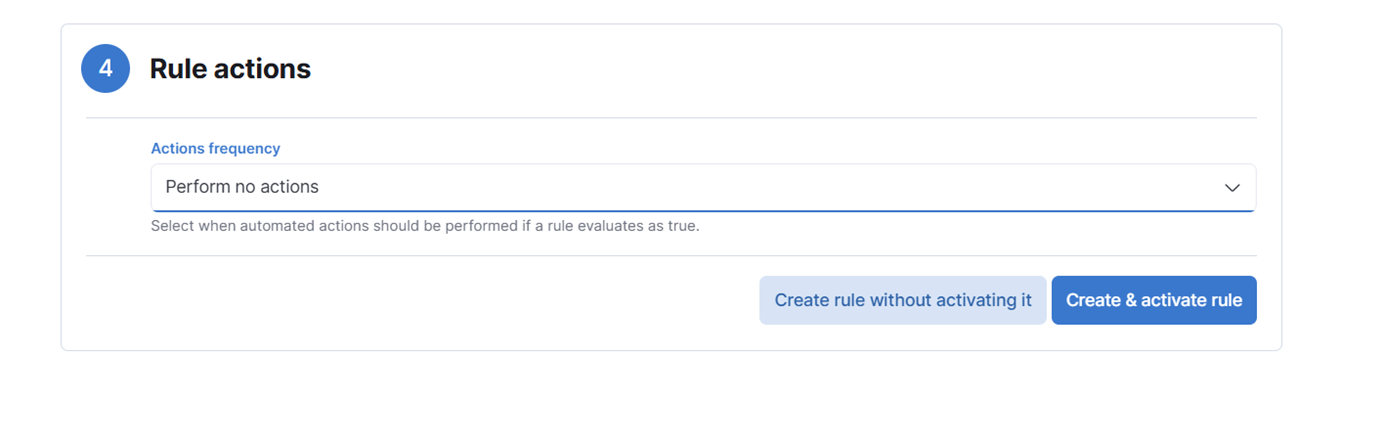
8. Skip rule actions for now (optional). We won’t add any rule actions, but you can experiment if you want to try different approaches.
9. Click “Create & activate rule.”
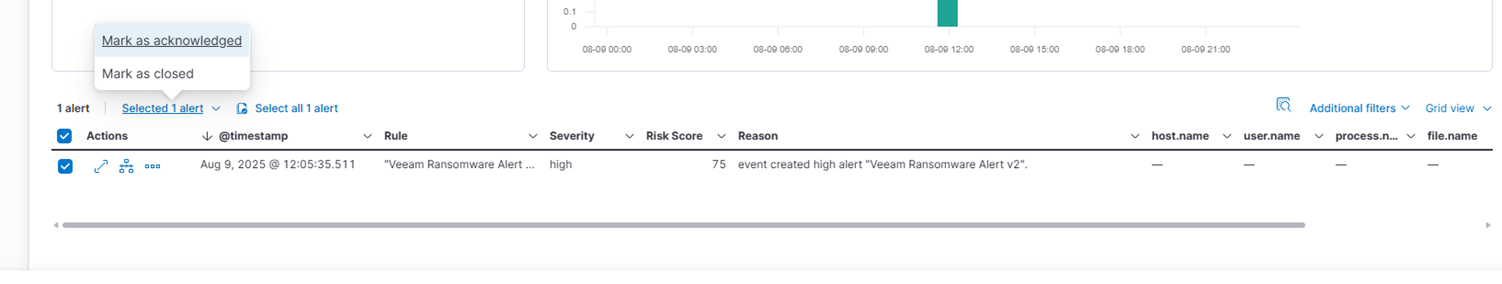
Step 4: Trigger the Alert Again
Send another test message to trigger the rule:
echo '<14>1 2025-03-20T14:06:09.662307+02:00 VBRSRV01 Veeam_MP - - [origin enterpriseId="31023"] [categoryId=0 instanceId=41600 DetectionTimeUTC="03/20/2025 13:05:41" OibID="0e54d3bf-add8-48eb-9122-fad3ac1e8fb3" ActivityType="EncryptedData" UserName="TECH\user1" ObjectName="VM01" VbrHostName="vbrsrv01.tech.local" Description="Potential malware activity detected"]' | nc -u -q0 localhost 5514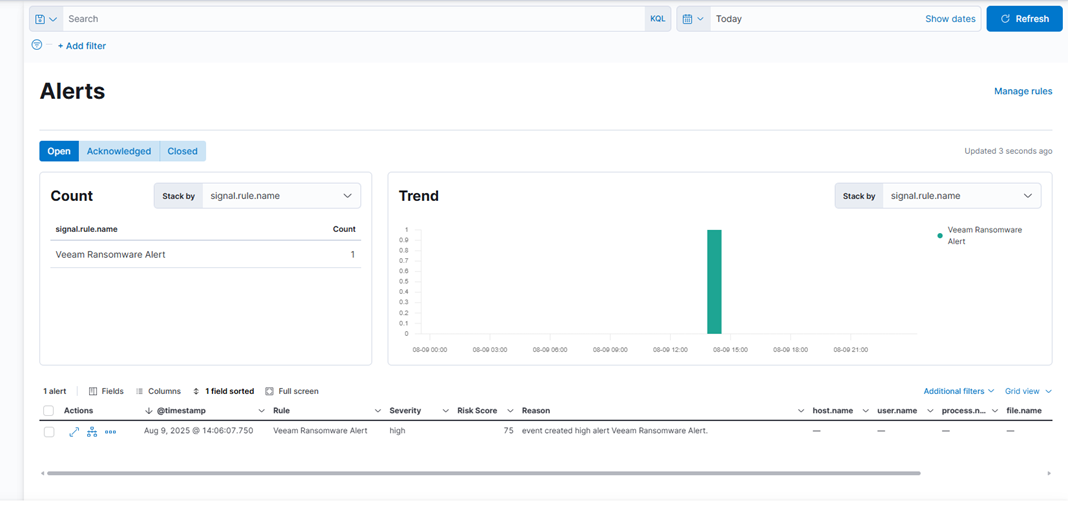
You should now see the alert appear in the Security → Alerts section. You can click on the alert to view details and acknowledge it.
Creating Security Dashboards
To build a security dashboard, go to Analytics → Dashboard and add these visualizations:
- Failed Authentication Attempts Over Time: A line chart showing when login failures happen, helping you spot attack patterns and busy periods.
- Top Source IPs by Failed Attempts: A table listing IP addresses with the most failed logins, making it easy to identify repeat offenders.
- Geographic Distribution of Attacks: A map showing where attacks come from, giving you a global view of threat origins.
- Authentication Success vs Failure Ratio: A pie chart comparing successful and failed logins to highlight unusual activity.
- Risk Score Timeline: A histogram showing how risk scores change over time, helping you detect spikes in threat levels.
Advanced Security Features
Elastic Security offers tools to improve threat detection and analysis:
- Timeline: Lets analysts review security events in detail and understand how attacks unfold.
- Detection Rule Tuning: Helps reduce false alerts while keeping detection accurate. Regularly adjust rules based on normal system behavior. Use machine learning to spot unusual activity.
- Case Management: Tracks investigations and keeps audit records. Detection rules can automatically create cases with relevant details to speed up response.
Production Considerations
For secure, reliable deployments:
- Security Hardening: Use TLS encryption, enforce authentication and authorization, and apply regular updates. Deploy Elasticsearch in a cluster for high availability and set up backups.
- Resource Planning: Elasticsearch needs enough memory and fast storage. Set log retention policies that balance security and cost. Use index lifecycle management to handle old data automatically.
- Network Security: Use firewalls to limit access to EFK components. Segment your network to keep the security system separate from other infrastructure.
Conclusion
The EFK stack with Elastic Security gives you a strong foundation for monitoring and detecting threats. With this setup, you can collect, process, and analyze security logs, detect threats automatically, and visualize data through dashboards.
As your system grows, expand your log sources, create custom detection rules, and connect to external threat intelligence feeds. Effective security monitoring needs regular updates, tuning, and skilled analysts. The EFK stack provides the tools—success depends on how you use them.