 GB
GBIT Infrastructure & Data Protection Expert
In der letzten Ausgabe der SIEM-Serie haben wir EFK (Elasticsearch, Fluentd und Kibana) besprochen, das einen allgemeinen Überblick über den Technologiestack gab, bevor wir in praktische Übungen eintauchten. Zur Erinnerung: Diese Blog-Serie soll nicht die Kursausbildung ersetzen, sondern das Publikum in die Thematik des SIEM einführen und erklären, wie es auf einer grundlegenden Ebene funktioniert. Darüber hinaus wollte ich den Nutzern helfen, einfache Sandbox-Umgebungen zu schaffen, in denen sie während des Lernens üben können.
Was ist Wazuh?
Wazuh ist eine Open-Source-Komplettlösung für SIEM (Security Information and Event Management) und XDR (Extended Detection and Response). Es wurde 2015 als Fork von Ossec erstellt und sollte die Fähigkeiten letzterer modernisieren und erweitern. Ziel ist es, eine einheitliche Sicherheitsüberwachungslösung zu werden.
Es hat versucht, einige der Komplexitäten, die wir bei ELK beobachtet haben, anzugehen und es einfacher zu machen, ein eigenes Überwachungssystem zu erstellen.
Kernkomponenten von Wazuh
Wazuh ist eine leistungsstarke Open-Source-Sicherheitsplattform, die Bedrohungserkennung, Integritätsüberwachung, Vorfallreaktion und Compliance-Management integriert. Ihre Architektur ist modular und besteht aus mehreren Schlüsselkomponenten:
- Wazuh-Agent: Auf Endpunkten (Servern, VMs, Containern) installiert, sammelt der Agent Sicherheitsdaten wie Protokolle, Änderungen der Dateiintegrität und Systeminventar. Wazuh unterstützt auch agentenloses Monitoring über Syslog, SSH oder APIs für Geräte wie Firewalls und Router.
- Wazuh-Server: Die zentrale Verarbeitungseinheit der Plattform. Er empfängt Daten von Agenten oder externen Quellen, dekodiert sie, wendet Regeln an und generiert Alarme. Er verwaltet auch die Konfigurationen der Agenten und orchestriert die Kommunikation über die Plattform.
- Analyse-Engine: Ein Subsystem innerhalb des Wazuh-Servers, das Erkennungsregeln anwendet, Ereignisse korreliert und Bedrohungen identifiziert. Es bereichert Ereignisse mit Metadaten wie Regel-IDs und Schweregraden.
- Wazuh-Indexer: Auf OpenSearch basierend, speichert und indiziert diese Komponente Alarme und Ereignisse. Sie ermöglicht eine schnelle Suche, Filterung und Analyse großer Datensätze. Filebeat wird verwendet, um Daten sicher vom Server an den Indexer weiterzuleiten.
- Wazuh-Dashboard: Eine webbasierte Schnittstelle zur Visualisierung von Alarmen, Verwaltung von Agenten und Interaktion mit der Plattform. Es kommuniziert über eine RESTful API mit dem Wazuh-Server und unterstützt Echtzeitüberwachung, Bedrohungssuche und Compliance-Berichterstattung.
Wazuh kann als Einzelknoten- oder Mehrknotenarchitektur je nach Skalierbarkeit und Leistungsanforderungen bereitgestellt werden.
Wie Wazuh funktioniert: Eine Schritt-für-Schritt-Übersicht
Der Prozess kann in die folgenden Schritte zusammengefasst werden:
- Wazuh sammelt Daten von Endpunkten mithilfe von Agenten. Dazu gehören Protokolle, Systemaktivitäten und Dateiänderungen. Für Systeme ohne Agenten können Daten über Syslog, SSH oder APIs gesammelt werden.
- Der Server empfängt und dekodiert die Daten und bereitet sie für die Analyse vor.
- Die Analyse-Engine wendet Regeln an, um Bedrohungen oder Richtlinienverstöße zu erkennen. Alarme werden generiert und mit relevanten Details angereichert.
- Alarme und Ereignisse werden an den Indexer gesendet, wo sie gespeichert und durchsuchbar gemacht werden.
- Das Dashboard ermöglicht es den Nutzern, Alarme anzuzeigen, Systeme zu überwachen und Konfigurationen über eine Weboberfläche zu verwalten.
Wie wir bereits in dieser Serie behandelt haben, sind rohe Syslog-Nachrichten nicht ideal für den Aufbau von Dashboards oder das Auslösen von Alarmen. Um sie nützlich zu machen, müssen wir sie in strukturierte, lesbare Daten zerlegen. Einfach ausgedrückt, ist die Erstellung klarer Schlüssel-Wert-Paare entscheidend – insbesondere bei der Arbeit mit Visualisierungstools wie Kibana oder dem Wazuh-Dashboard.
Parsing und mehr Parsing
Logstash und Fluentd sind allgemeine Protokollverarbeitungs-Engines und wurden für Flexibilität entwickelt. Oft erfordert Flexibilität jedoch Komplexität. Während unseres Durchlaufbeispiels des Grok-Parsings war offensichtlich, dass dies eine erlernte Fähigkeit ist und Zeit und Mühe erfordert, um Expertise zu erlangen.
Wazuh wählte einen etwas anderen Weg und verwendet zwei Stufen zur Verarbeitung der Protokolle. Die erste Stufe nutzt Decoder, während die zweite Stufe die Regeln verwendet. Wazuh versucht, das Parsen von Protokollen zu Sicherheitszwecken zu erleichtern, indem es Decoder und Vorschriften mit integrierten Sicherheitsparsern nutzt.
Kurz gesagt, so können wir vergleichen, was wir bei Logstash/Fluentd gesehen haben, mit Wazuh-Decodern und -Regeln:
| Aspekt | Logstash/Fluentd | Wazuh-Decoder & Regeln |
| Zweck | Generische Protokollverarbeitung | Analyse von Sicherheitsereignissen |
| Out-of-Box-Fähigkeit | Leere Pipeline | Über 3.000 Sicherheitsregeln bereit |
| Sicherheitskontext | Manuelle Implementierung | Integrierte Bedrohungsintelligenz |
| Feldextraktion | Generische Grok-Muster | Sicherheitsbewusste Decoder |
| Korrelation | Manuelle Konfiguration | Automatische Ereigniskorrelation |
| Compliance-Mapping | Benutzerdefinierte Entwicklung | Vorab zu Frameworks zugeordnet |
| Bedrohungserkennung | Von Grund auf neu erstellen | Sofortige Bedrohungserkennung |
| Zeit bis zum Sicherheitswert | Wochen/Monate | Stunden/Tage |
Sandbox-Tutorial
Wie in unseren vorherigen Beiträgen in dieser SIEM-Serie geht es uns um praktisches Lernen. In dieser Übung werden wir mit einer Ubuntu-virtuellen Maschine arbeiten, um Wazuh direkt auf dem Betriebssystem zu installieren – diesmal ohne Docker. Für unser Testlabor-Setup bietet Wazuh ein praktisches Installationsskript, das den Prozess schnell und unkompliziert macht.
Bitte verwenden Sie diesen Link für den Tutorial-Bereich:
https://documentation.wazuh.com/current/quickstart.html
Wazuh Einzelknoteninstallation
1. Führen Sie das folgende Skript aus:
curl -sO https://packages.wazuh.com/4.12/wazuh-install.sh && sudo bash ./wazuh-install.sh -acurl -sO https://packages.wazuh.com/4.12/wazuh-install.sh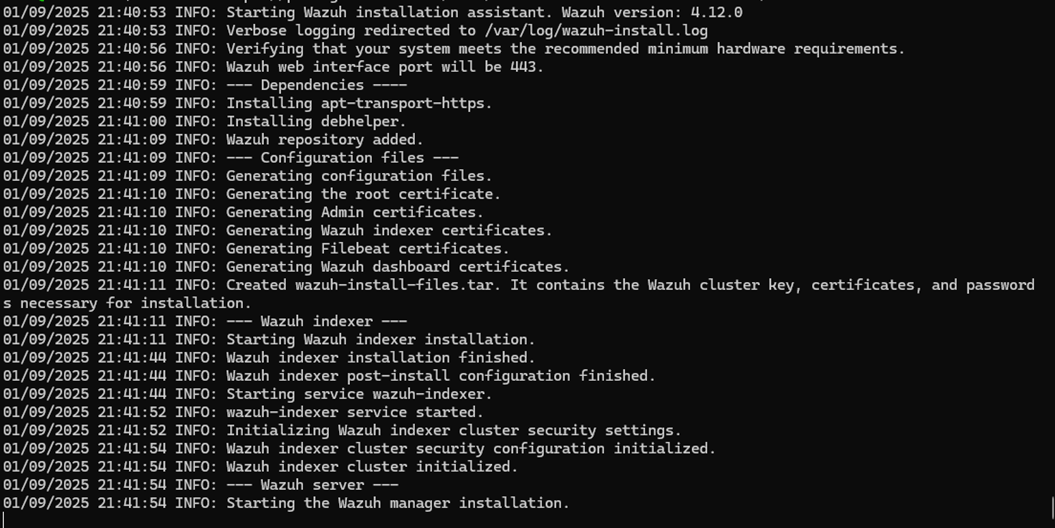
2. Wenn das Skript abgeschlossen ist, notieren Sie sich das Admin-Passwort.
3. An diesem Punkt sollten Sie in der Lage sein, einen Browser zu öffnen und zur IP-Adresse oder zum DNS-Namen Ihrer Wazuh-VM zu navigieren. Wenn alles korrekt eingerichtet ist, wird das Wazuh-Dashboard geladen, das Ihnen Zugang zu Ihrer SIEM-Umgebung gibt.
Zur Referenz, hier ist, was ich verwendet habe: https://wazuh02
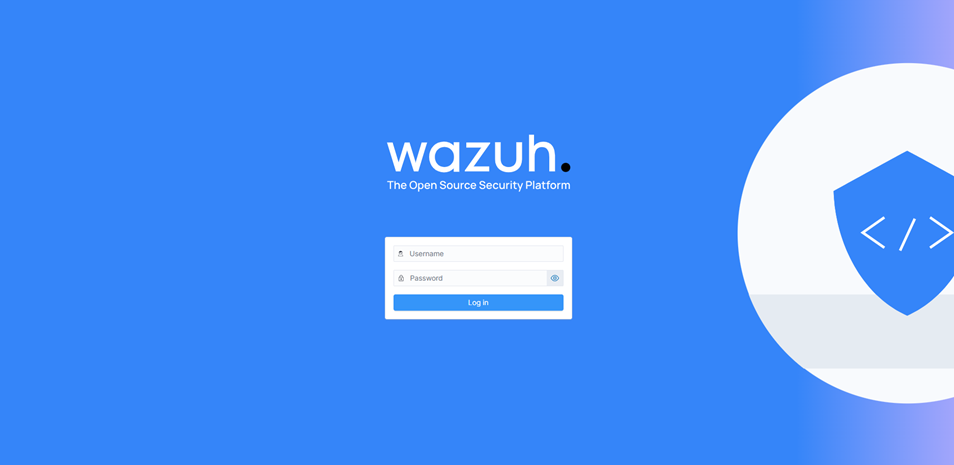
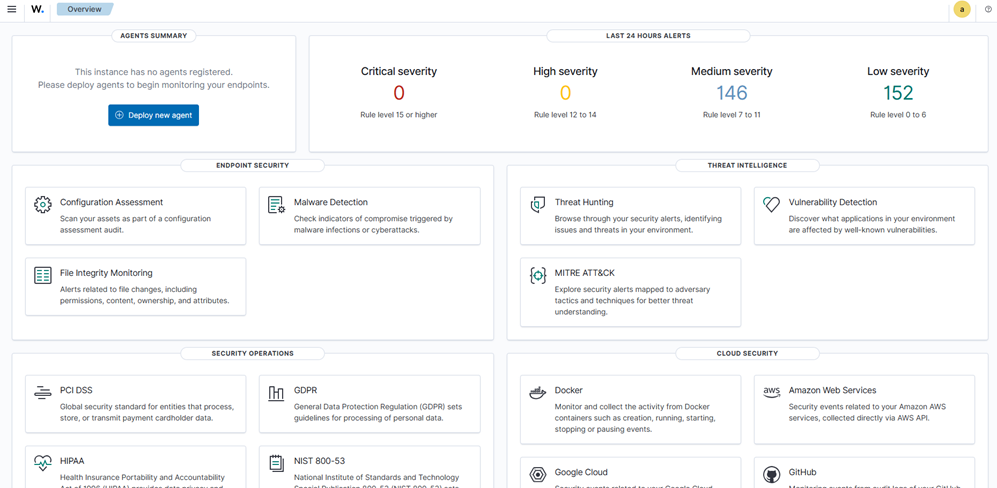
4. Melden Sie sich mit dem Benutzernamen admin und dem Passwort an, das nach Abschluss des Installationsskripts in Ihrem Terminal angezeigt wurde. Nach der Anmeldung präsentiert Wazuh ein reichhaltiges Dashboard voller Optionen zur Erkundung.
Einrichten von Decodern und Regeln für Ootbi Syslog-Integration
Wir haben ein GitHub-Repository mit einfachen Decodern und Regeln erstellt, die auf Object First’s Ootbi (Out-of-the-Box Immutability) Syslog-Weiterleitung zugeschnitten sind. Sie können sie herunterladen mit:
https://github.com/object1st/wazuh-examples.git
Noch kein Ootbi? Kein Problem. Wir werden Syslog-Nachrichten simulieren, um zu demonstrieren, wie Wazuh sie verarbeitet.
Dateiablage
Anstatt die Standarddateien local_decoder.xml und local_rules.xml zu ändern, empfehlen wir, separate Dateien für eine bessere Organisation zu erstellen, insbesondere wenn Sie planen, mehrere Ereignistypen zu verwalten.
Kopieren Sie die folgenden Dateien:
1. Aus dem Decoder-Ordner:
- honeypot_application_decoders.xml
- ootbi_working_decoders.xml Dateien
Platzieren Sie sie in: /var/ossec/etc/decoders/
2. Aus dem Regel-Ordner:
- honeypot_application_rules.xml
- ootbi_final_rules.xml Dateien
Platzieren Sie sie in: /var/ossec/etc/rules/
Wazuh konfigurieren, um Syslog-Nachrichten zu empfangen
1. Stellen Sie sicher, dass Wazuh auf eingehende Syslog-Verbindungen hört, indem Sie den folgenden Abschnitt hinzufügen:
/var/ossec/etc/ossec.conf file under </ossec_config>

<remote>

    <connection>syslog</connection>

    <port>514</port>

    <protocol>udp</protocol>

    <allowed-ips>192.168.0.0/24</allowed-ips>

    <allowed-ips>127.0.0.1</allowed-ips>

</remote>
2. Aktualisieren Sie allowed-ips, um Ihr Subnetz anzupassen.
3. Starten Sie den Wazuh-Manager-Dienst neu:
systemctl restart wazuh-manager4. Überprüfen Sie, ob der Port lauscht:
Ss -tunlp 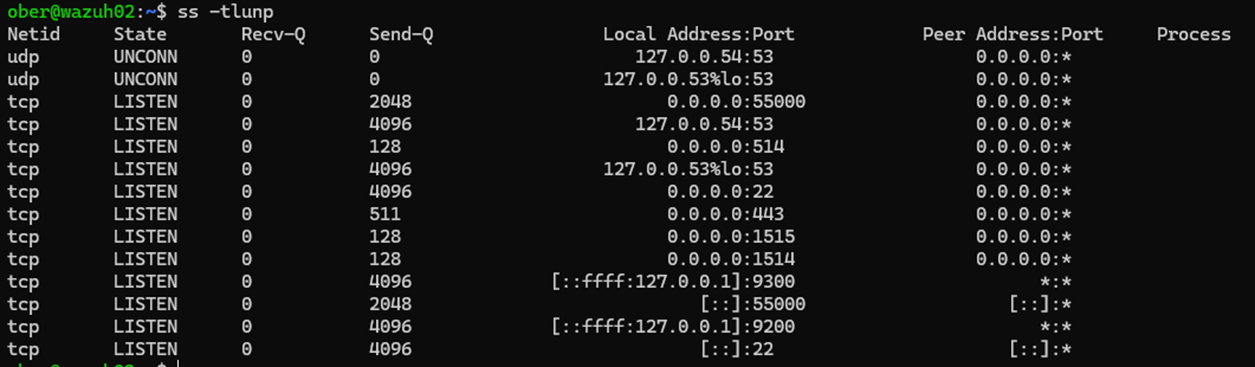
Test-Syslog-Nachrichten senden
Sie können Testnachrichten an Wazuh mit netcat senden:
echo '<14>Aug 26 19:00:00 ootbisiem OOTBI [ootbi_event@61062 Node="ootbisiem" Source="Disks" EventId="1039"] The RAID array "md0" is missing.' | nc -q0 localhost 514

echo ‘<12>1 0001-01-01T00:00:00.000000+00:00 ootbi-node1 OOTBI - - [ootbi_event@61062 Node="ootbi-node1" NodeId="A410B7E9-FF68-4ADF-B570-A964C6F45D98" DateTime="01/01/0001 00:00:00 UTC" Source="S3" EventId="6207" ProductVersion="1.7.67.10970" EDataVersion="1"] '{}' smart entity is in '{}' unconfirmed state’ | nc  -q0 localhost 514
Ereignisse im Wazuh-Dashboard anzeigen
Öffnen Sie im Wazuh-Dashboard das Menü oben links und klicken Sie auf „Erforschen“ und dann auf „Entdecken“.
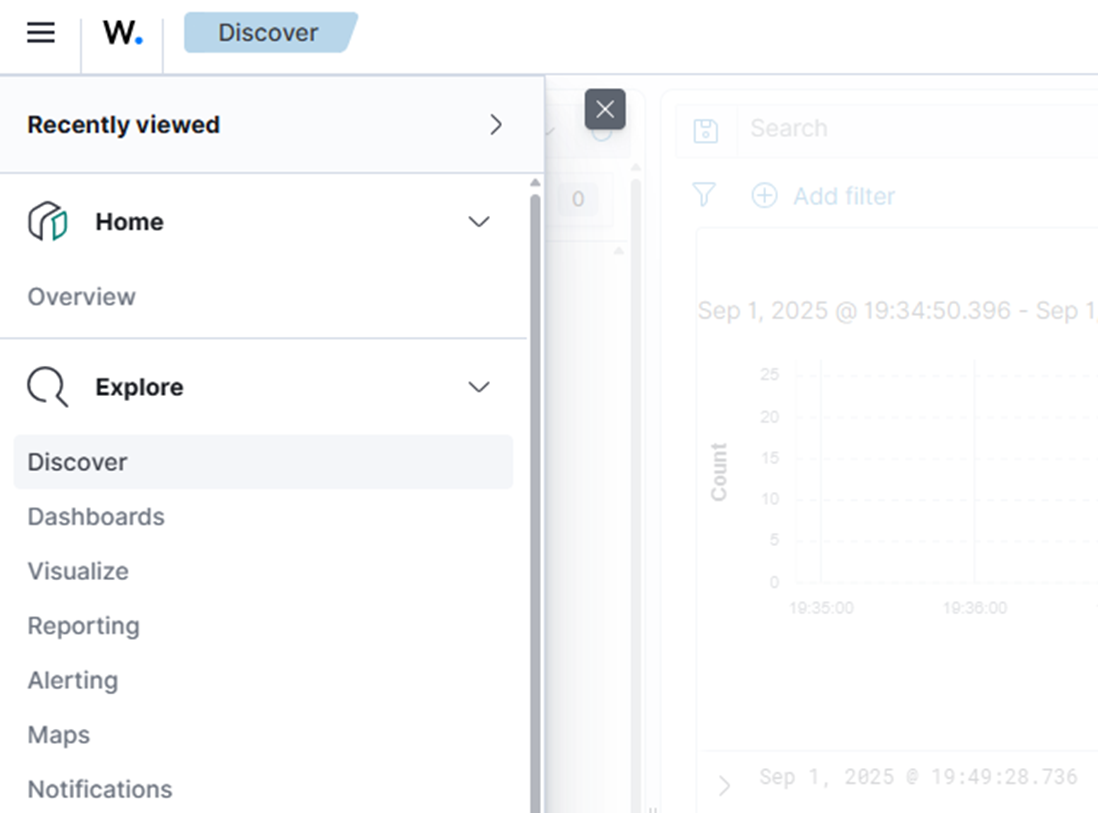
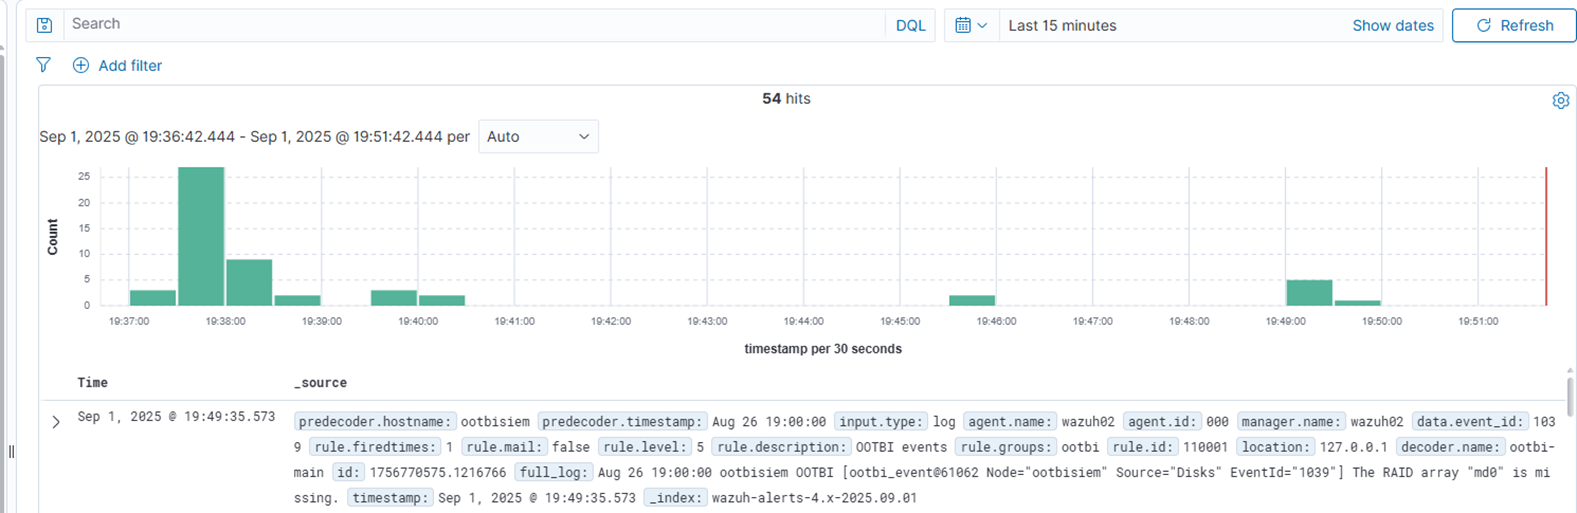
Sie sollten jetzt die gesendeten Syslog-Nachrichten sehen.
Importieren des Ootbi Dashboards
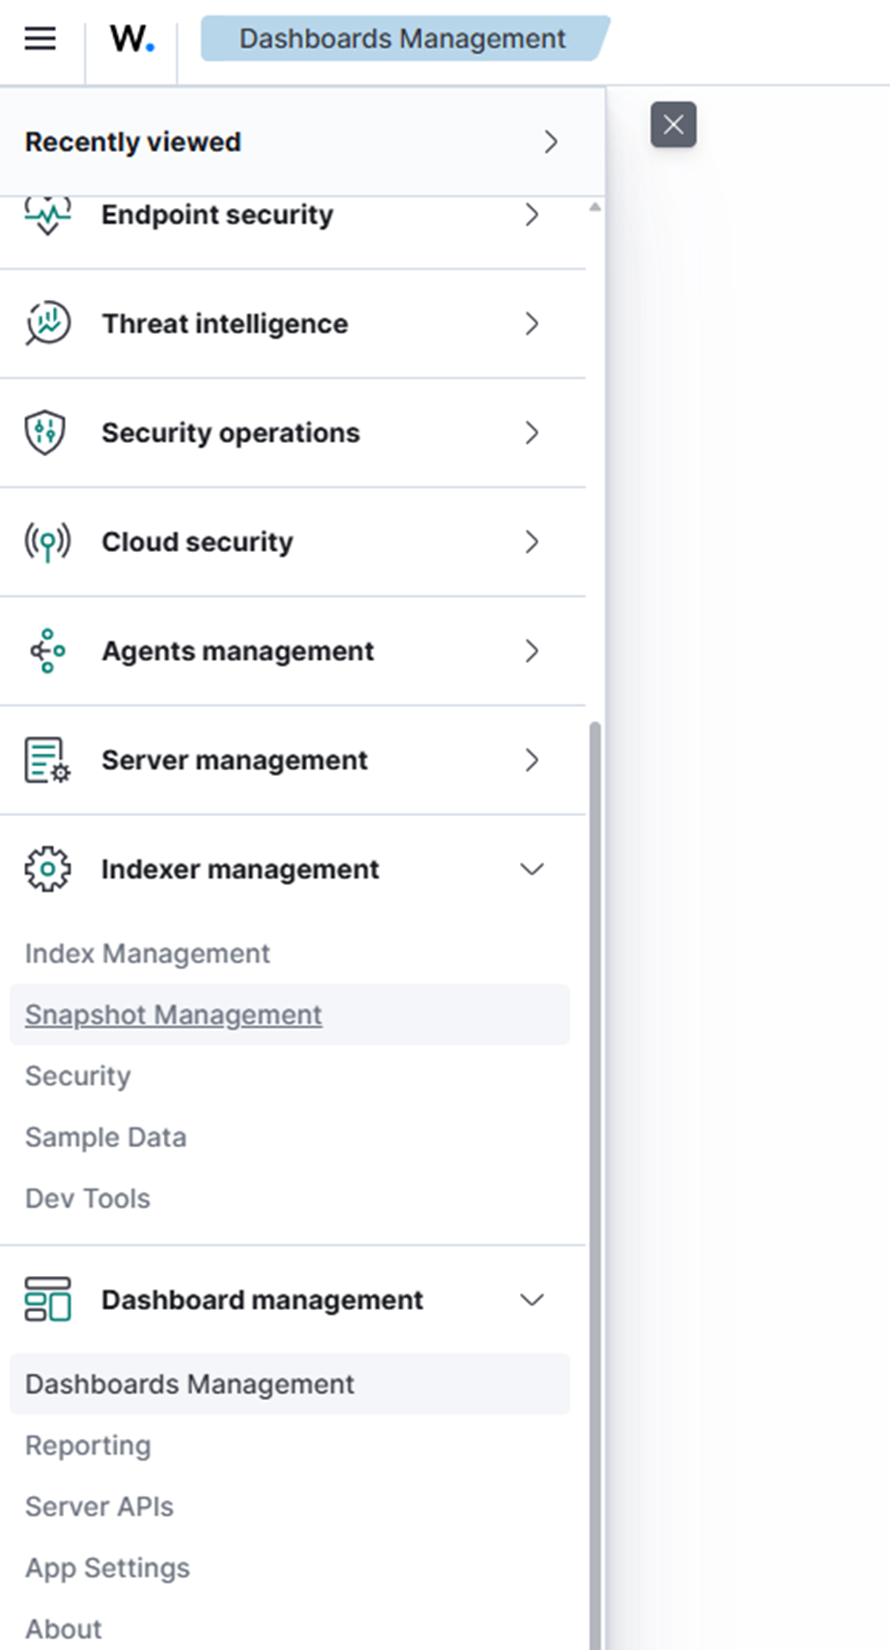
1. Gehen Sie im Menü oben links zu Dashboard-Verwaltung.
2. Klicken Sie unter „Gespeicherte Objekte“ auf „Importieren“.
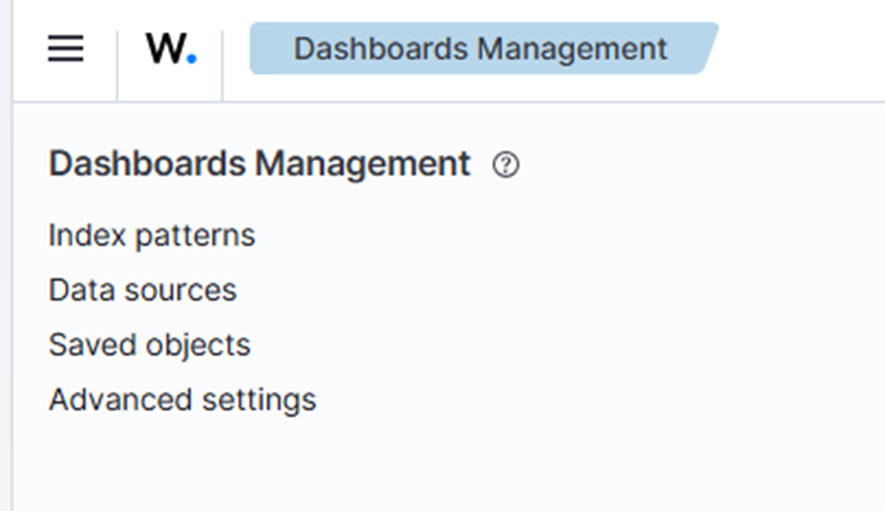
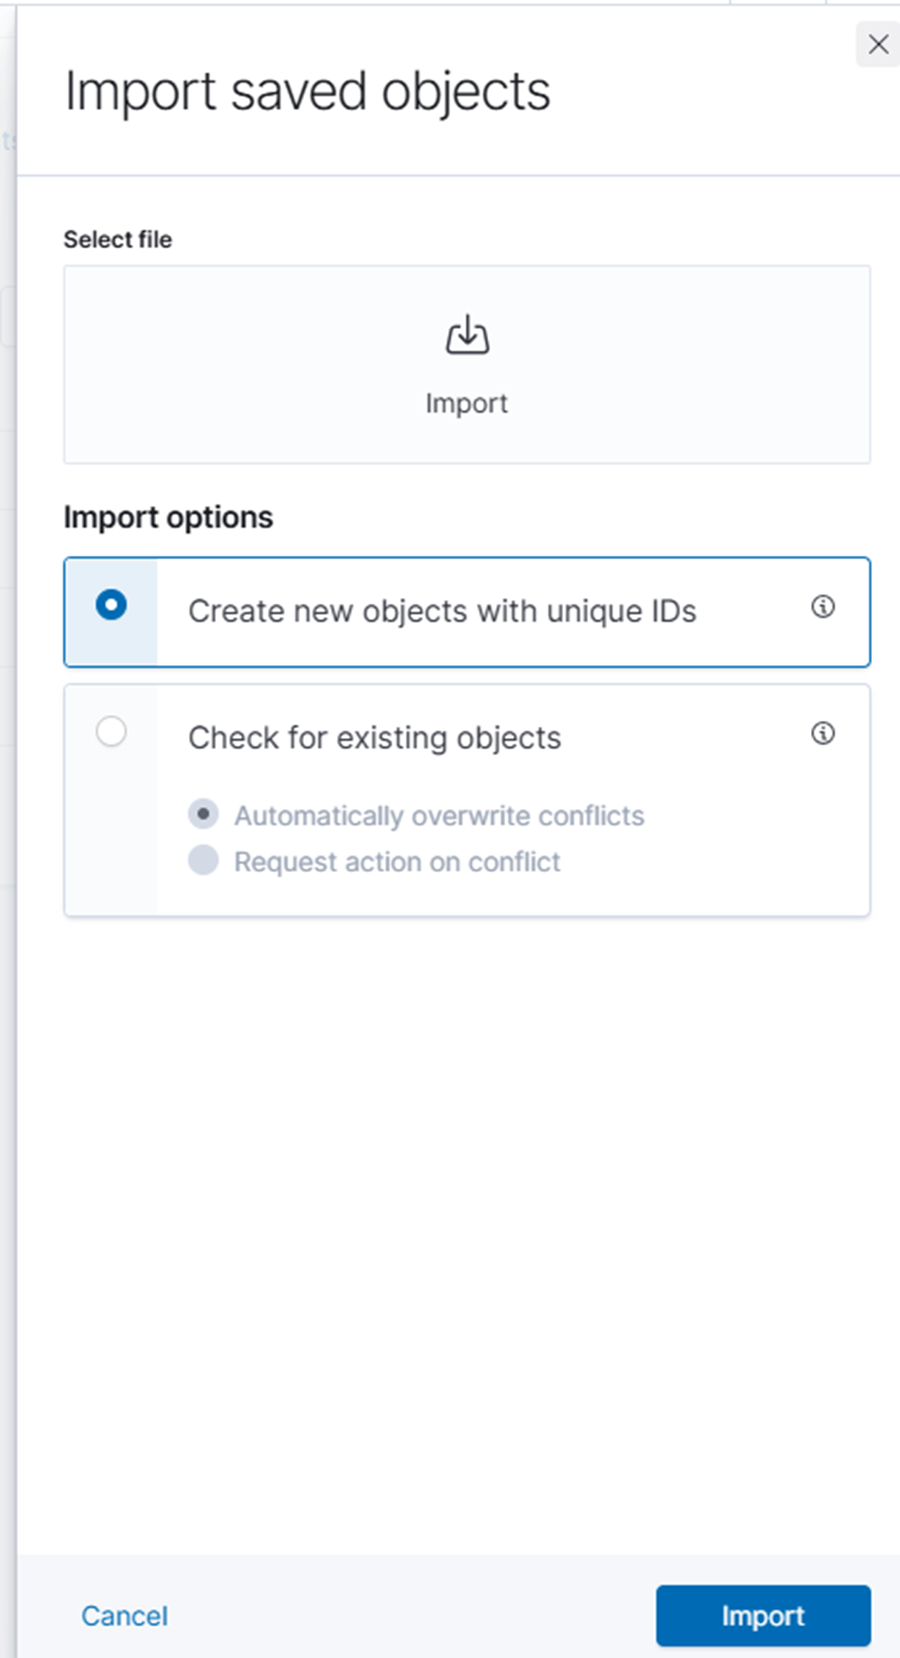
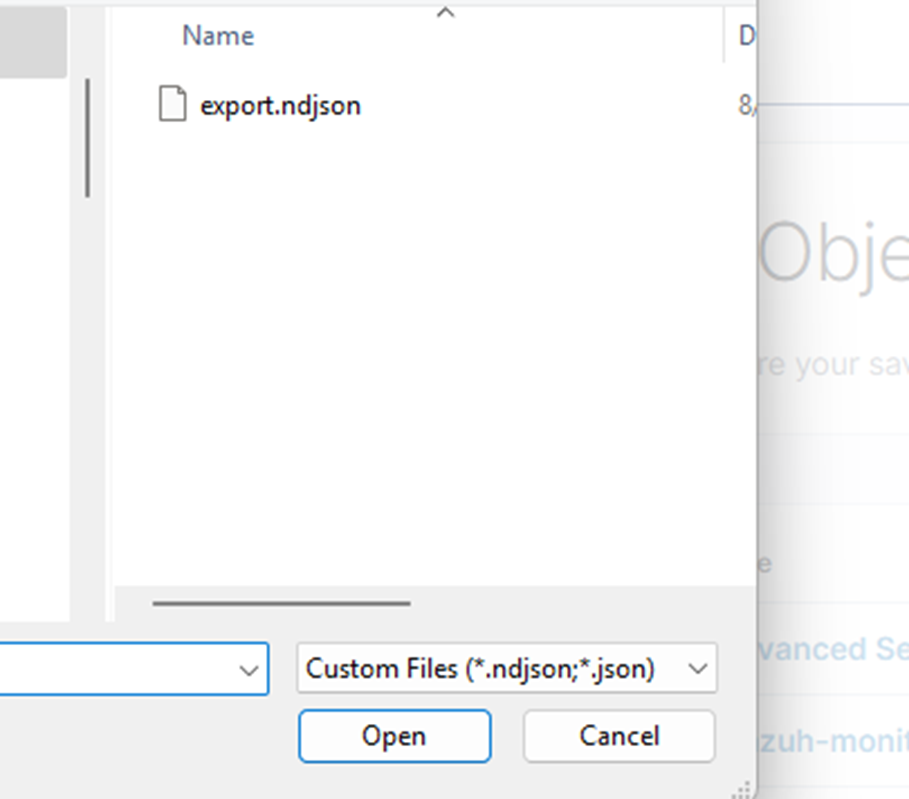
3. Laden Sie die Datei export.ndjson von Ihrem Desktop hoch.
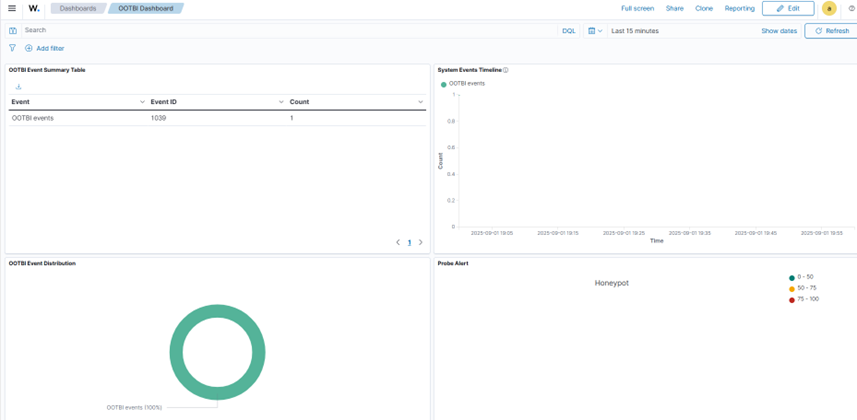
4. Nach dem Import klicken Sie auf „Erforschen“ und dann auf „Dashboards“.
5. Klicken Sie anschließend auf das „Ootbi Dashboard.“ Sie sehen die zuvor gesendeten Ereignisse angezeigt.
Testen der Honeypot-Funktion
Da Wazuh als SIEM fungiert, ist dies eine großartige Gelegenheit, die neue Honeypot-Funktion von Ootbi zu testen.
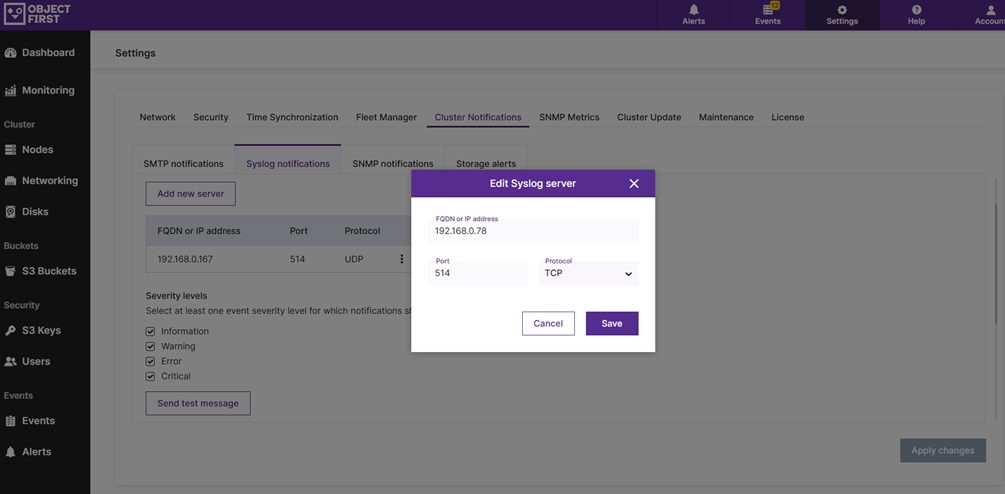
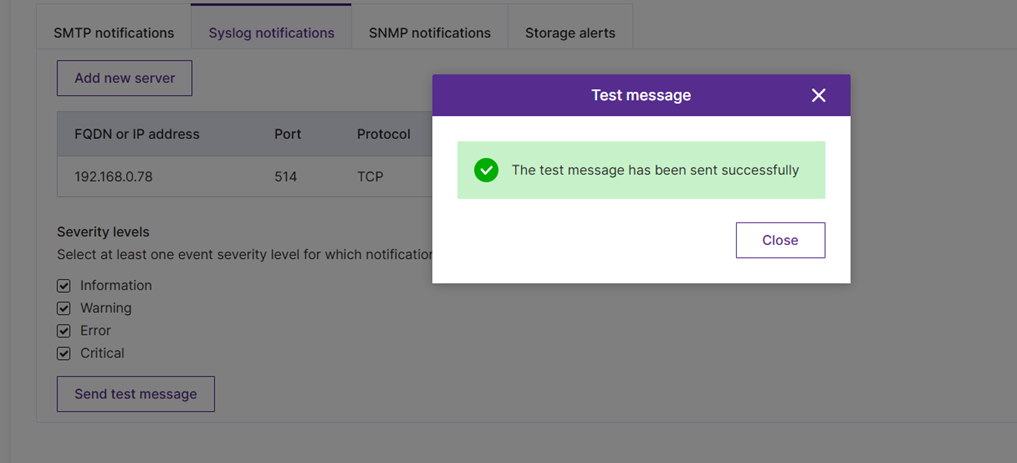
1. Um zu beginnen, richten Sie Ihre Ootbi Syslog-Weiterleitung auf die Wazuh-Installation aus.
2. Senden Sie dann eine Testnachricht, um den Empfang zu bestätigen.
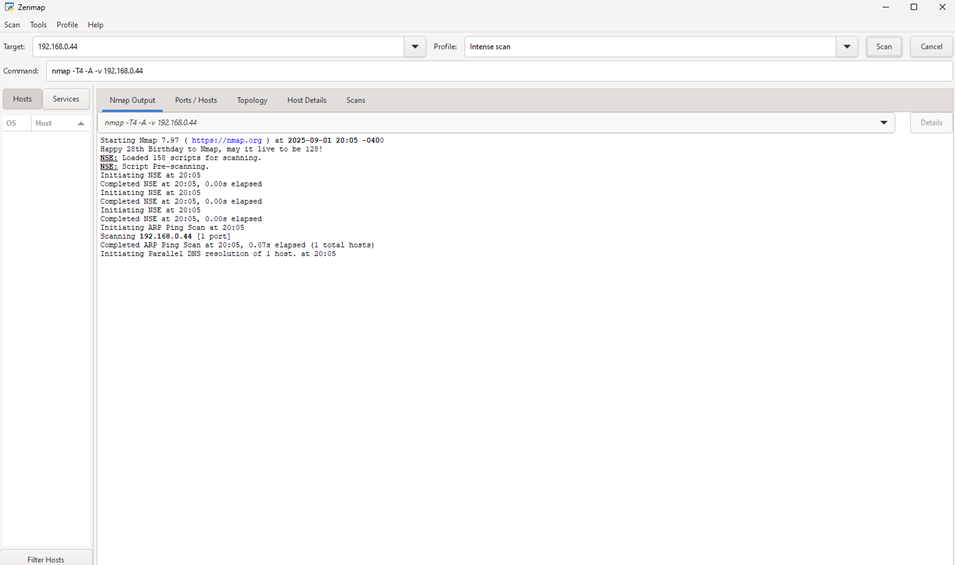
3. Wenn Ihr Honeypot auf einer statischen IP läuft (meine ist zum Beispiel 192.168.0.44), scannen Sie ihn mit Zenmap.
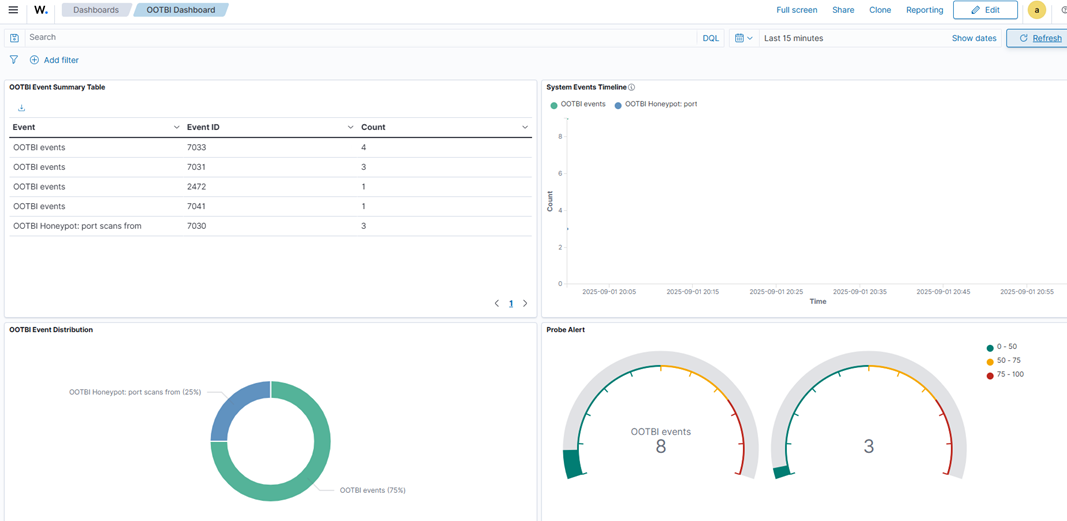
5. Sie sollten sehen, wie Ereignisse im Ootbi Dashboard aufleuchten und entsprechende Einträge in Ihrem Wazuh SIEM-Dashboard erscheinen.
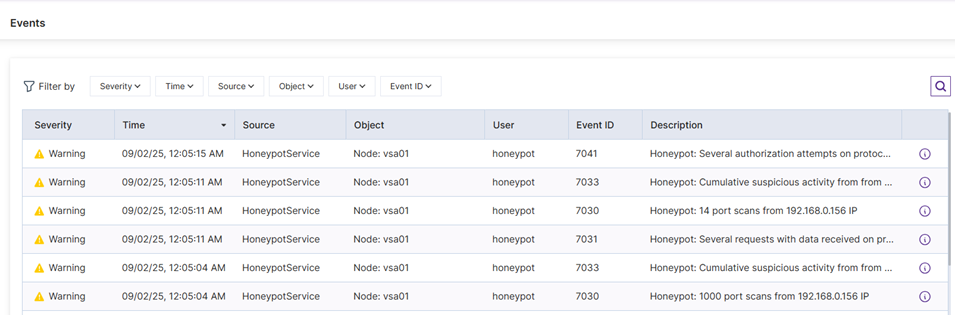
6. Lassen Sie uns nun unser SIEM überprüfen:
Abschließende Gedanken zur Wazuh-Installation und -Integration
Dieser Blog diente als praktische Einführung in Wazuh, eine Open-Source-SIEM- und XDR-Plattform, die entwickelt wurde, um die Sicherheitsüberwachung und Bedrohungserkennung zu vereinfachen. Wir haben die modulare Architektur erkundet – einschließlich Agenten, Server, Analyse-Engine, Indexer und Dashboard – und eine Installation auf einem einzelnen Knoten unter Ubuntu mit dem optimierten Installationsskript von Wazuh durchgeführt. Von dort aus haben wir demonstriert, wie man Decoder und Regeln für die Syslog-Integration konfiguriert, Ereignisse simuliert und sie im Wazuh-Dashboard visualisiert.
Wir haben auch gezeigt, wie man ein benutzerdefiniertes Dashboard importiert und die Honeypot-Funktion von Ootbi testet, was den Lesern einen praktischen Einblick gibt, wie Wazuh in realen Szenarien eingesetzt werden kann. Egal, ob Sie neu bei SIEM-Tools sind oder nach einer sicherheitsorientierteren Alternative zu traditionellen Protokollprozessoren suchen, Wazuh bietet eine leistungsstarke und zugängliche Lösung. Für weitere Erkundungen empfehle ich dringend, die offizielle Dokumentation von Wazuh zu überprüfen.