 GB
GBIT Infrastructure & Data Protection Expert
Em nosso último blog sobre ELK, configuramos o ELK (Elasticsearch, Logstash e Kibana) no Docker. Agora vamos transformar esses logs complexos em blocos de construção que permitirão que você crie visualizações no Kibana.
Se você ainda não leu Prática Prática com o ELK Stack, então você pode começar clonando o seguinte repositório do GitHub para configurar seu ELK Stack: https://github.com/object1st/elk-stack.git
cd elk-stack
comando de execução:
docker-compose up -dEm seguida, navegue até o seu navegador no endereço IP ou nome DNS da sua VM (ou host local se você estiver fazendo isso localmente) e na porta 5601, acesse o Kibana: http://myvm:5601
Analisando Syslog
Ao final deste guia, você pode esperar ter:
- Analisado uma mensagem syslog complexa
- Criado detecção inteligente de ameaças que identifica automaticamente um indicador de ransomware
- Construído um painel para exibir o alerta
O Desafio: Estruturas de Log Complexas
Vamos começar com uma mensagem syslog do mundo real.
Exemplo: Veeam Detecção de Malware
Mar 20, 2025 @ 14:06:09.662 VBRSRV01 Veeam_MP: [origin enterpriseId="31023"] [categoryId=0 instanceId=41600 DetectionTimeUTC="03/20/2025 13:05:41" OibID="0e54d3bf-add8-48eb-9122-fad3ac1e8fb3" ActivityType="EncryptedData" UserName="TECH\user1" ObjectName="VM01" VbrHostName="vbrsrv01.tech.local" Description="Potential malware activity detected for OIB: 0e54d3bf-add8-48eb-9122-fad3ac1e8fb3 (VM01), rule: Encrypted data by user: TECH\user1."]Por que essas mensagens são importantes
Você encontrará insights valiosos nesta mensagem de log—reserve um momento para explorá-la.
Veeam mensagem:
- Atividade potencial de ransomware em andamento
- Conta de usuário específica envolvida (TECH\user1)
- Máquina virtual afetada (VM01)
- Padrão comportamental (Atividade de Dados Criptografados)
Mas em seu estado atual, você não pode facilmente:
- Rastrear quais VMs estão potencialmente afetadas.
- Correlacionar atividade suspeita ao longo do tempo
- Gerar relatórios sobre essa atividade
Passo 1: Comece Simples, Construa Inteligente
Aqui é onde a maioria das pessoas erra: tentando analisar tudo de uma vez e acabando com uma configuração que não funciona.
Se você gostaria de acompanhar, localize os arquivos na pasta “Exemplos” do repositório do GitHub. Se você já instalou o ELK no Docker a partir de o post anterior do blog, simplesmente copie esses arquivos para sua configuração. À medida que você trabalha neste blog, substitua os arquivos existentes pelas versões atualizadas fornecidas aqui. Se você cometer um erro ou se perder enquanto edita, você sempre pode re-clonar o repositório para começar do zero.
- Para usar, exclua o logstash.conf no pipeline substituindo-o por
logstash_version1.conf ($ cp ~/elk-stack/Examples/logstash_version1.conf ~/elk-stack/logstash/pipeline/logstash.conf) - Reinicie o contêiner do logstash ($ docker-compose restart logstash).
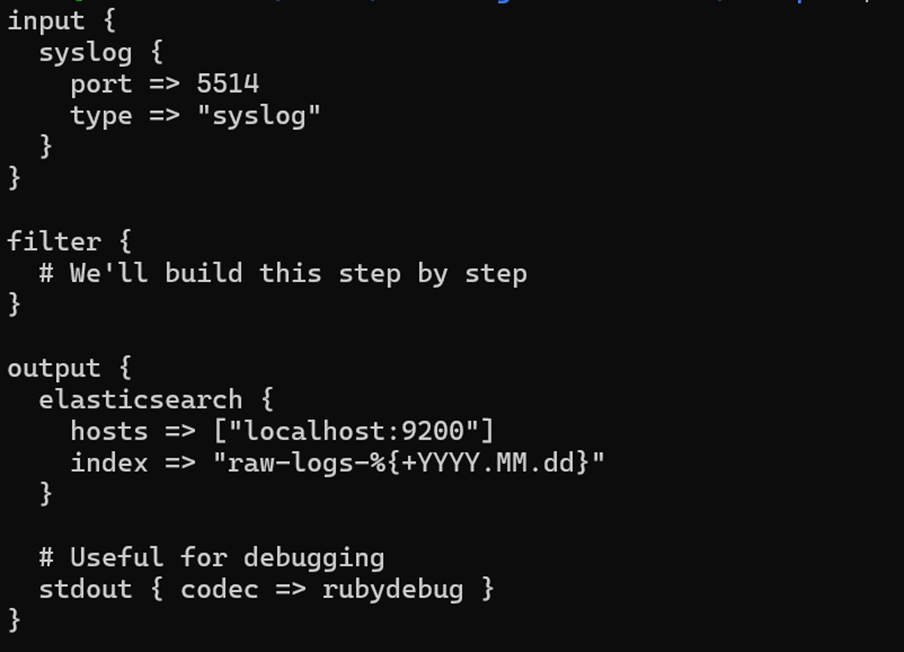
Por que essa abordagem funciona:
- Comece com entrada/saída funcionando
- Use stdout para ver exatamente o que o Logstash recebe (será exibido nos logs do contêiner docker)
- Logs brutos ainda vão para o Elasticsearch (nada é perdido)
- Construa complexidade gradualmente sem quebrar as coisas
Passo 2: Teste Sua Configuração
- Envie suas mensagens de amostra para o Logstash e observe a saída. Aqui estão alguns métodos que você pode usar para enviar uma mensagem syslog você mesmo.
- Usando netcat:
- Copie e cole o seguinte comando no seu CLI (Veeam Mensagem Syslog):
echo '<14>1 2025-03-20T14:06:09.662307+02:00 VBRSRV01 Veeam_MP - - [origin enterpriseId="31023"] [categoryId=0 instanceId=41600 DetectionTimeUTC="03/20/2025 13:05:41" OibID="0e54d3bf-add8-48eb-9122-fad3ac1e8fb3" ActivityType="EncryptedData" UserName="TECH\user1" ObjectName="VM01" VbrHostName="vbrsrv01.tech.local" Description="Potential malware activity detected"]' | nc -u -q0 localhost 5514- Você deve ver algo assim quando digitar docker logs logstash:
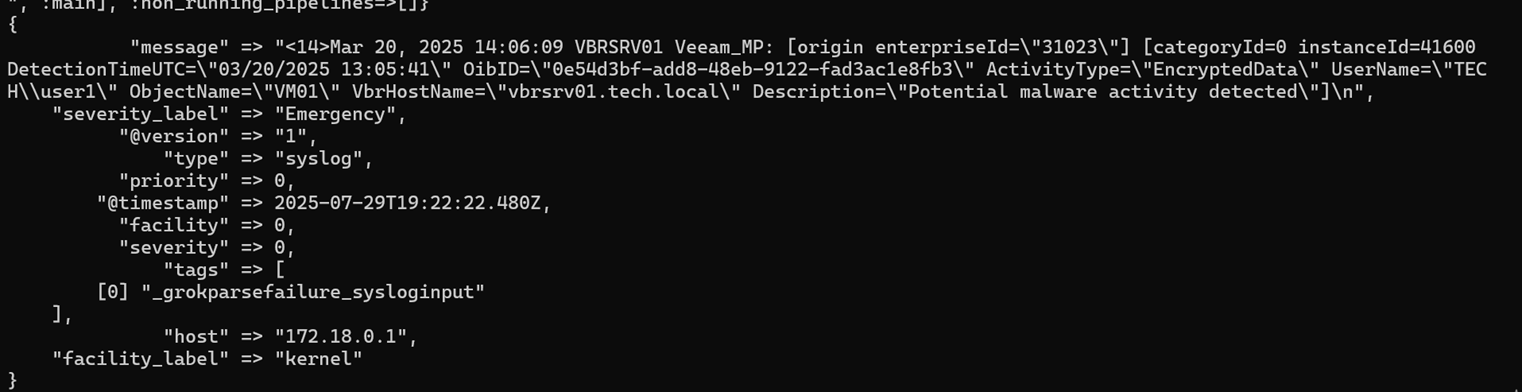
Este é um problema porque tudo o que é valioso está preso em um único campo de mensagem gigante:
“"message" => "<14>1 2025-03-20T14:06:09.662307+02:00 VBRSRV01 Veeam_MP - - [origin enterpriseId=\"31023\"] [categoryId=0 instanceId=41600 DetectionTimeUTC=\"03/20/2025 13:05:41\" OibID=\"0e54d3bf-add8-48eb-9122-fad3ac1e8fb3\" ActivityType=\"EncryptedData\" UserName=\"TECH\\user1\" ObjectName=\"VM01\" VbrHostName=\"vbrsrv01.tech.local\" Description=\"Potential malware activity detected\"]\n",”Para resolver esse problema, analise os logs para torná-los mais limpos.
Aqui é onde as coisas ficam interessantes (e um pouco aterrorizantes se você é novo em regex). Vamos dissecar este log e torná-lo mais fácil de extrair pedaços de informação.
Antes de escrever qualquer código, vamos entender com o que estamos lidando:
Veeam Estrutura: [timestamp] [hostname] [application]: [origin_data] [detection_data]
Passo 3: Análise Básica
Copie o próximo arquivo do logstash:
1. Para usar, exclua o logstash.conf no pipeline substituindo-o por logstash_version2.conf ($
cp ~/elk-stack/Examples/logstash_version2.conf ~/elk-stack/logstash/pipeline/logstash.conf) 2. Reinicie o contêiner do logstash ($ docker-compose restart logstash)
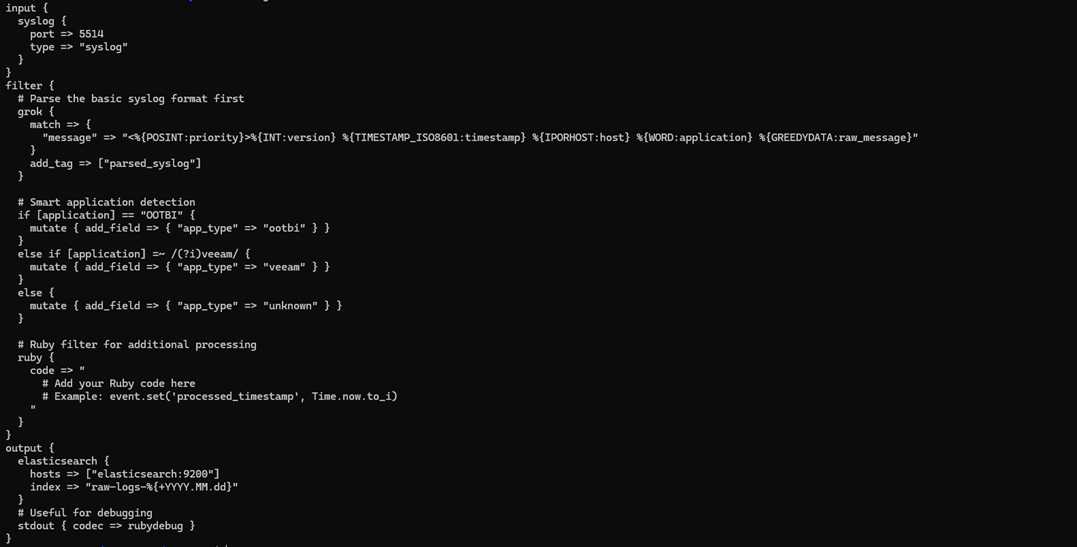
Padrão Grok Decodificado:
- %{POSINT:priority} → Captura inteiros positivos como "priority"
- %{TIMESTAMP_ISO8601:timestamp} → Padrão embutido para timestamps ISO
- %{IPORHOST:host} → Endereço IP ou hostname
- %{GREEDYDATA:raw_message} → Tudo o mais (vamos analisar isso a seguir)
Este novo padrão Grok é projetado para dividir mensagens syslog brutas em dados estruturados e utilizáveis. Especificamente, ele separa os componentes básicos de uma mensagem syslog (como timestamp, hostname e nível de log), identifica a fonte do aplicativo que gera o log e marca cada mensagem para processamento adicional ao longo do pipeline. Este passo fundamental é o que permite uma análise mais avançada, enriquecimento e lógica de alerta mais tarde no fluxo de trabalho.
3. Teste novamente para ver as diferenças:
echo '<14>1 2025-03-20T14:06:09.662307+02:00 VBRSRV01 Veeam_MP - - [origin enterpriseId="31023"] [categoryId=0 instanceId=41600 DetectionTimeUTC="03/20/2025 13:05:41" OibID="0e54d3bf-add8-48eb-9122-fad3ac1e8fb3" ActivityType="EncryptedData" UserName="TECH\user1" ObjectName="VM01" VbrHostName="vbrsrv01.tech.local" Description="Potential malware activity detected"]' | nc -u -q0 localhost 55144. Em seguida, verifique os logs do contêiner do logstash ($ docker logs logstash).
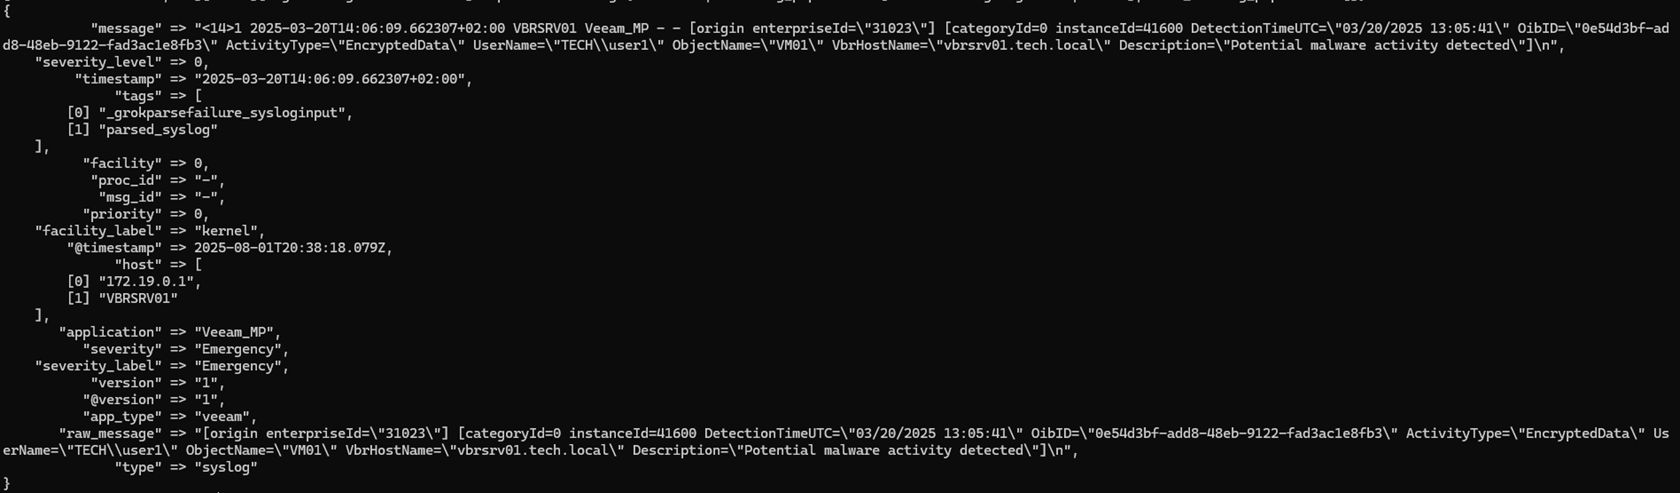
Os campos que extraímos:
priority → 0
timestamp → 2025-03-20T14:06:09.662307+02:00
host → ["172.19.0.1", "VBRSRV01"]
application → "Veeam_MP"
severity → "Emergency"
severity_level → 0
Passo 4: Análise Mais Profunda
Agora faremos ainda mais análise. O arquivo é grande demais para imprimir aqui, mas está na sua pasta “Exemplos” como logstash_version3.conf.
- Para usar, exclua o logstash.conf no pipeline substituindo-o por: logstash_version3.conf ($
cp ~/elk-stack/Examples/logstash_version3.conf ~/elk-stack/logstash/pipeline/logstash.conf) - Reinicie o contêiner do logstash ($ docker-compose restart logstash).
- Neste ponto, teste sua configuração. Você deve ver campos individuais em vez de uma grande massa de mensagem.
- Execute a mesma mensagem de teste novamente, depois verifique os logs do contêiner do logstash ($ docker logs logstash).
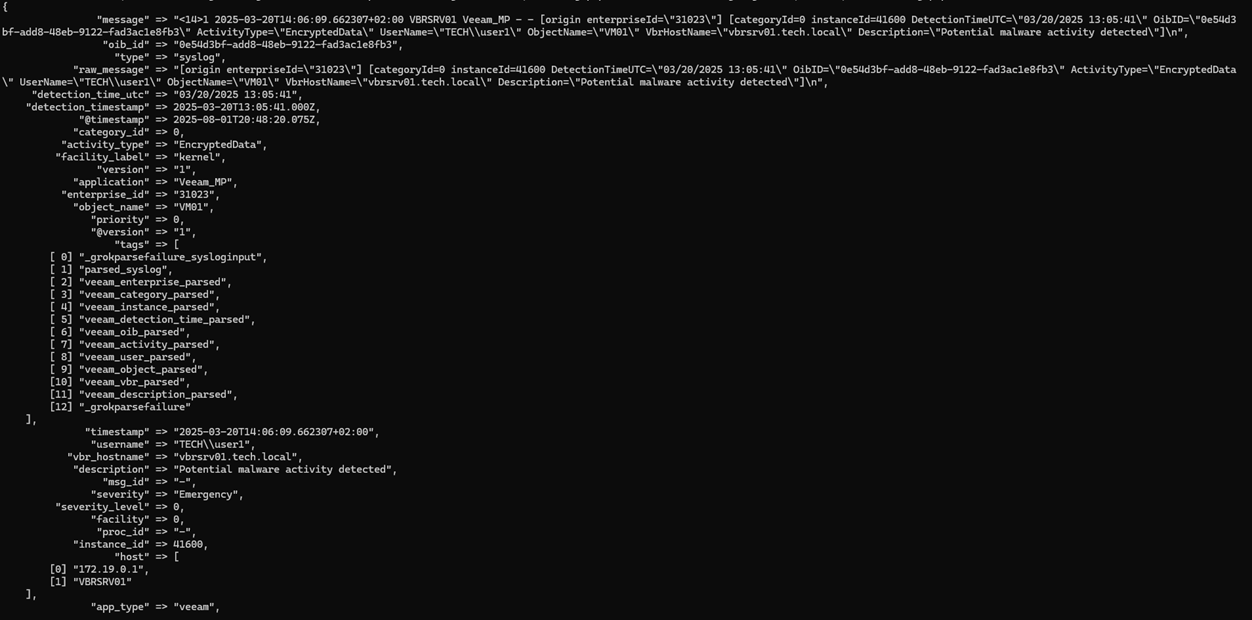
Os campos que extraímos:
enterprise_id → "31023"
category_id → 0 (convertido para inteiro)
instance_id → 41600 (convertido para inteiro)
detection_time_utc → "03/20/2025 13:05:41"
detection_timestamp → 2025-03-20T13:05:41.000Z (timestamp analisado corretamente)
oib_id → "0e54d3bf-add8-48eb-9122-fad3ac1e8fb3" (ID de alerta único)
activity_type → "EncryptedData" (indicador de malware)
username → "TECH\\user1"
object_name → "VM01" (VM afetada)
vbr_hostname → "vbrsrv01.tech.local"
description → "Atividade potencial de malware detectada"
Passo 5: Veeam Inteligência de Ameaças e Tratamento de Erros
Por último, mas não menos importante, precisamos adicionar inteligência ao nosso sistema e tratamento de erros para nos ajudar a depurar, se necessário. Adicionar inteligência é importante porque permite filtrar por impacto nos negócios, possibilita alertas baseados em prioridade, torna a criação de painéis intuitiva, fornece recomendações acionáveis e reduz a fadiga de alertas.
Aqui está como adicionar inteligência e tratar erros:
- Para usar, exclua o logstash.conf no pipeline substituindo-o por: logstash_version4.conf ($
cp ~/elk-stack/Examples/logstash_version4.conf ~/elk-stack/logstash/pipeline/logstash.conf) - Reinicie o contêiner logstash ($ docker-compose restart logstash).
- Aguarde até que o pipeline esteja em execução e envie a mensagem de teste novamente:
echo '<14>1 2025-03-20T14:06:09.662307+02:00 VBRSRV01 Veeam_MP - - [origin enterpriseId="31023"] [categoryId=0 instanceId=41600 DetectionTimeUTC="03/20/2025 13:05:41" OibID="0e54d3bf-add8-48eb-9122-fad3ac1e8fb3" ActivityType="EncryptedData" UserName="TECH\user1" ObjectName="VM01" VbrHostName="vbrsrv01.tech.local" Description="Potential malware activity detected"]' | nc -u -q0 localhost 5514Quais novos campos extraímos:
threat_type → "potential_ransomware" (categorização inteligente de ameaças)
event_category → "malware" (classificação de segurança)
business_impact → "high" (avaliação de risco)
alert_priority → "critical" (prioridade de escalonamento)
recommendation → "Investigação imediata necessária" (orientação de resposta)
event_type → "security_event" (classificação de evento)
Resumo da Seção
Nesta seção, concluímos com sucesso o seguinte:
- Adicionamos contexto de negócios a eventos brutos
- Criamos classificação de severidade inteligente
- Construímos um sistema de categorização de ameaças
- Habilitamos alertas baseados em prioridade
Passo 6: Criar um Modelo de Índice
Antes de começarmos a enviar dados para o Elasticsearch, precisamos otimizá-lo para nosso caso de uso específico.
1. No repositório do GitHub, você encontrará o arquivo index_template.json, que podemos importar para o Kibana.
2. Vamos usar um comando curl para importar nosso index_template.json da pasta “Examples”.
Se você tiver problemas para copiar os comandos aqui, também pode encontrá-los no arquivo README.md do repositório do github
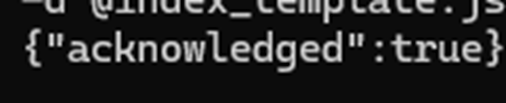
curl -X PUT "localhost:9200/_index_template/veeam-syslog-template" \ -H "Content-Type: application/json" \ -d @index_template.json3. Você deve ver esta mensagem se a importação foi bem-sucedida.
4. Em seguida, criaremos um Padrão de Índice (em versões posteriores chamado de Visualizações de Dados).
- Digite o seguinte comando:
curl -X POST "localhost:5601/api/saved_objects/index-pattern/syslog-pattern" -H "Content-Type: application/json" -H "kbn-xsrf: true" -d '{"attributes":{"title":"syslog-*","timeFieldName":"@timestamp"}}'- Você também pode criar através da WebUI.
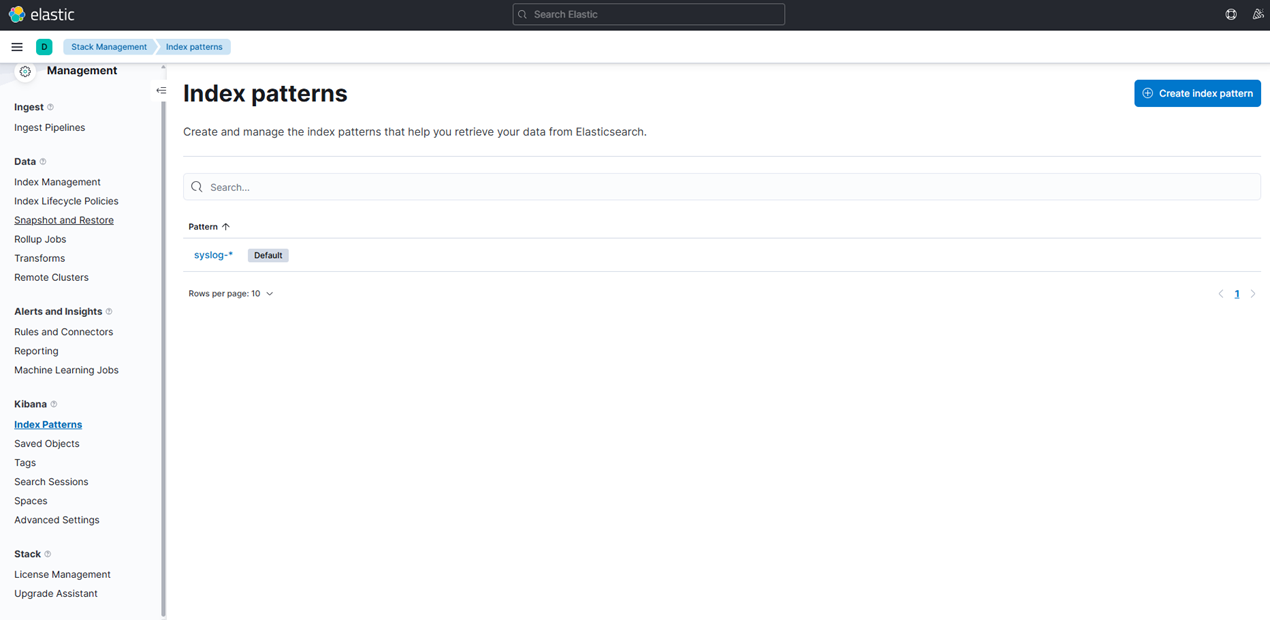
5. Verifique se o Padrão de Índice foi criado tomando as seguintes ações:
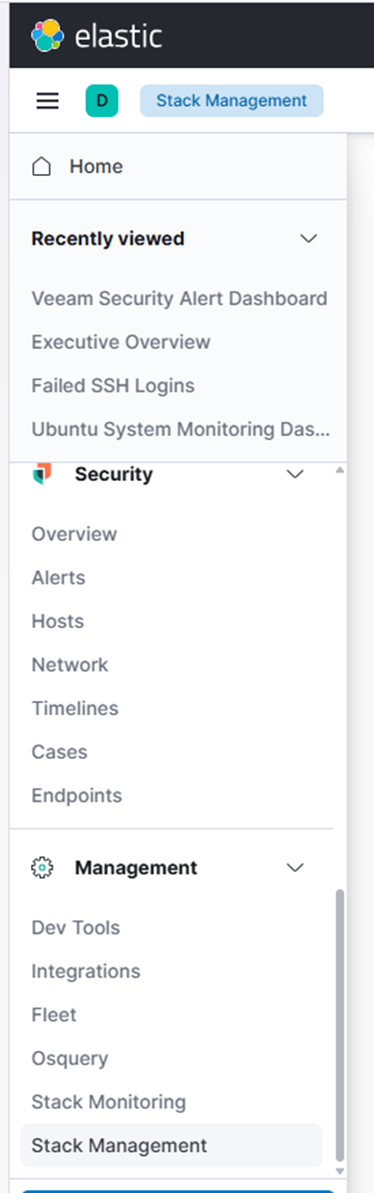
- Vá para Gerenciamento de Stack
- Clique em “Padrões de Índice” sob “Kibana”
- Aqui podemos ver nosso Padrão de Índice recém-criado.

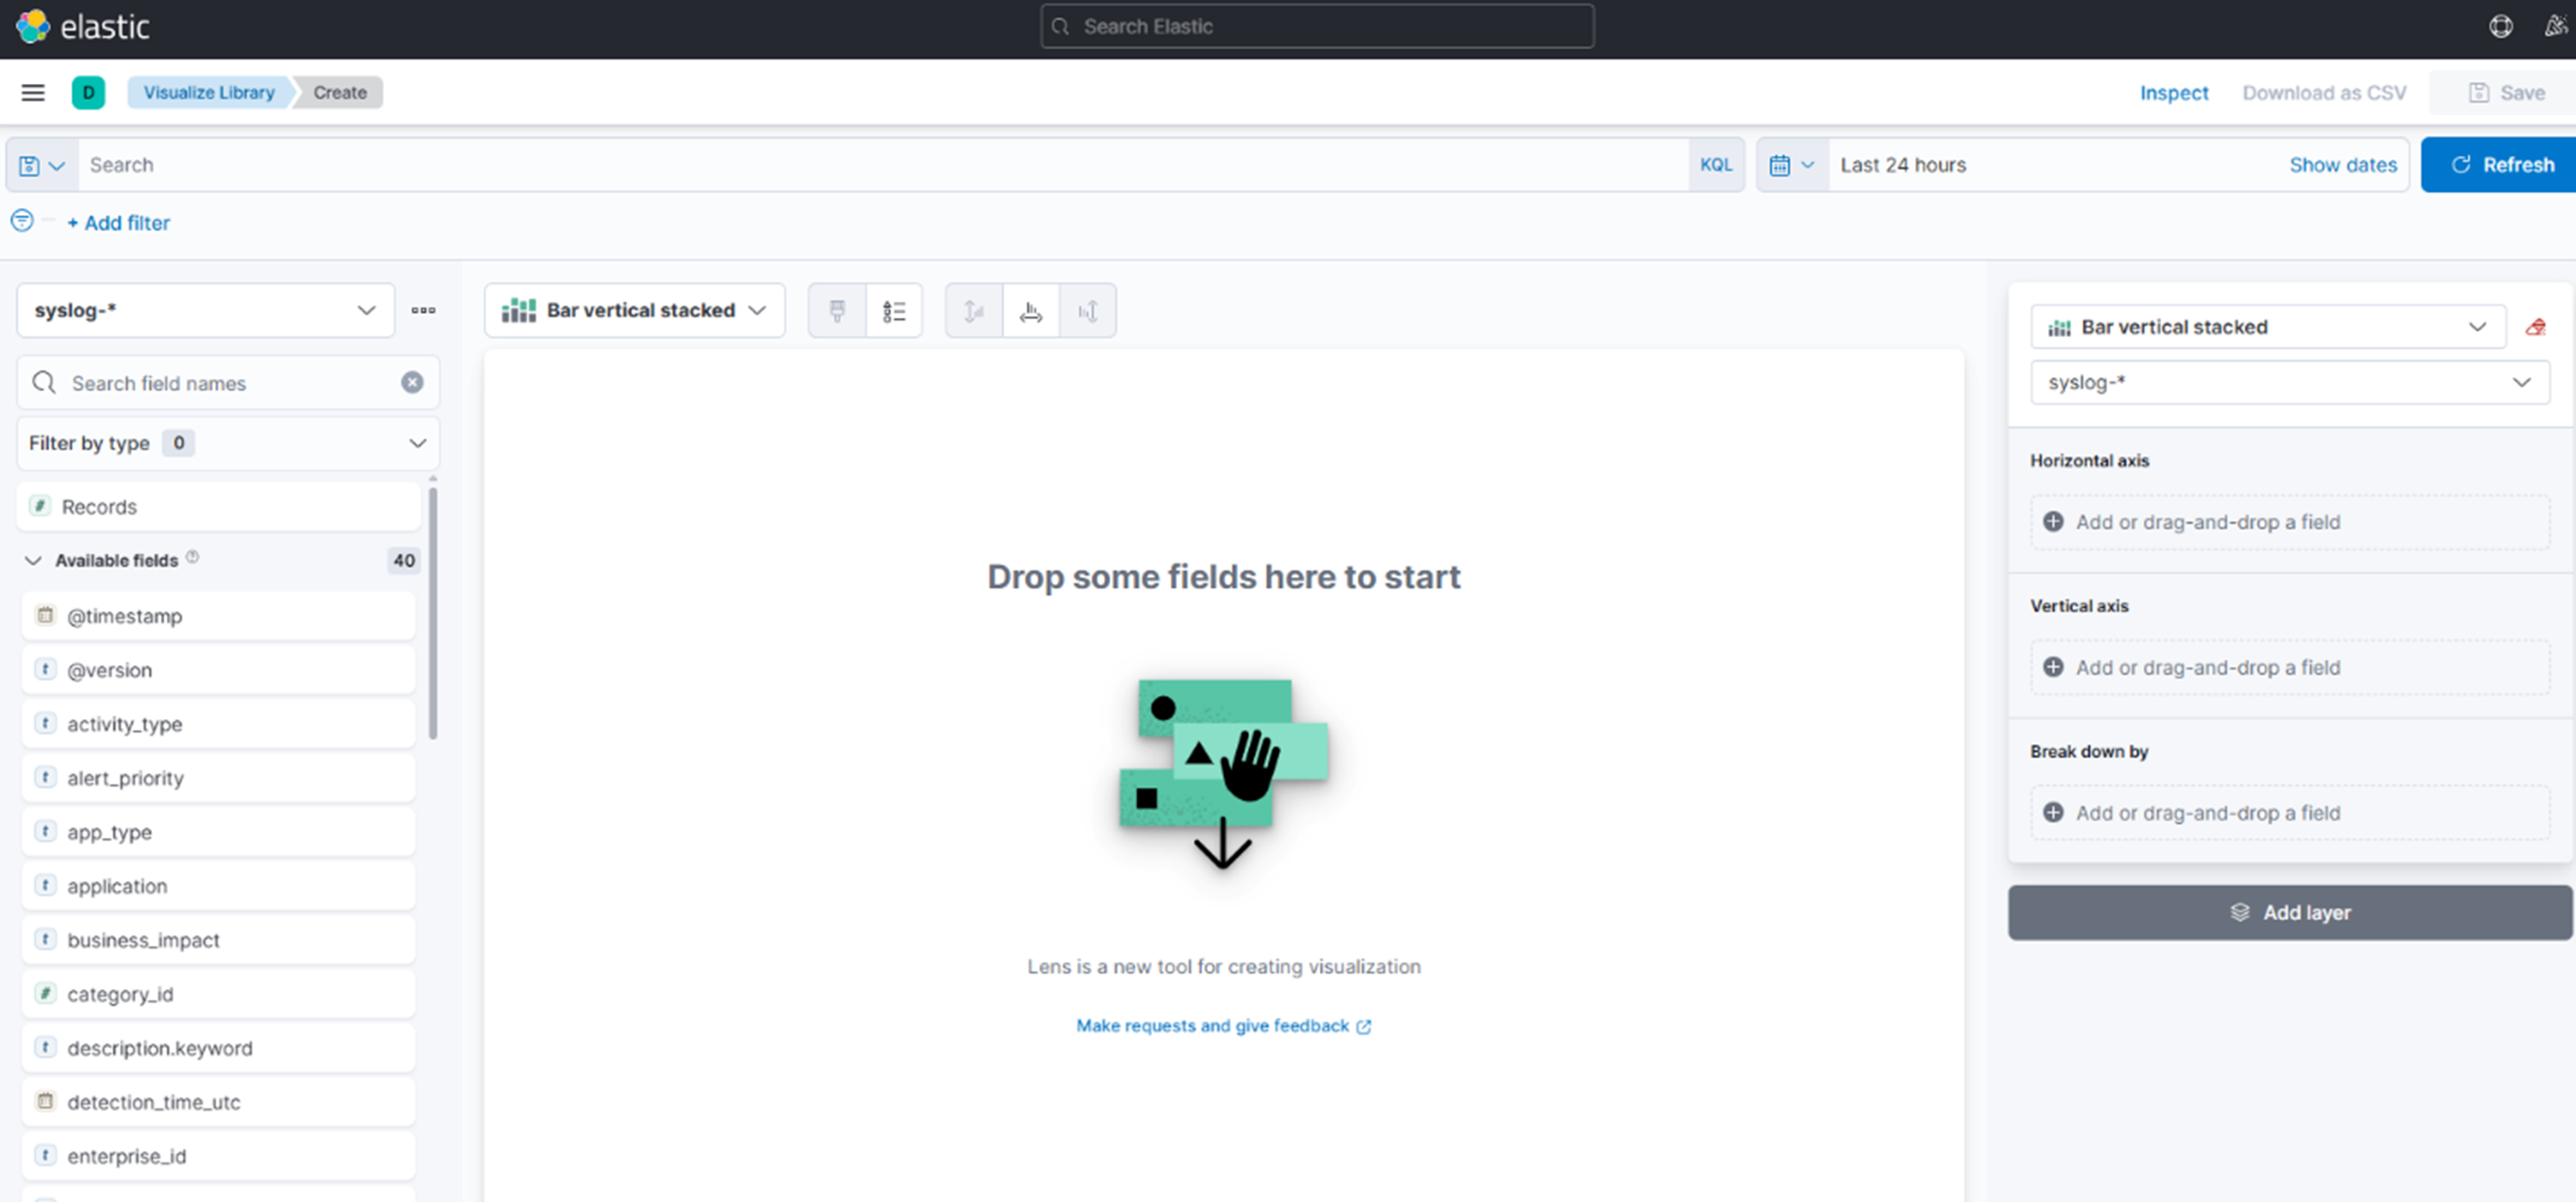
6. Em seguida, precisamos criar uma visualização.
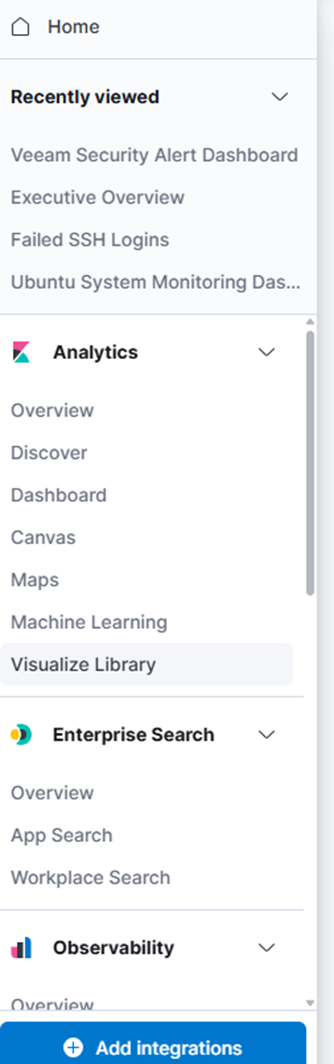
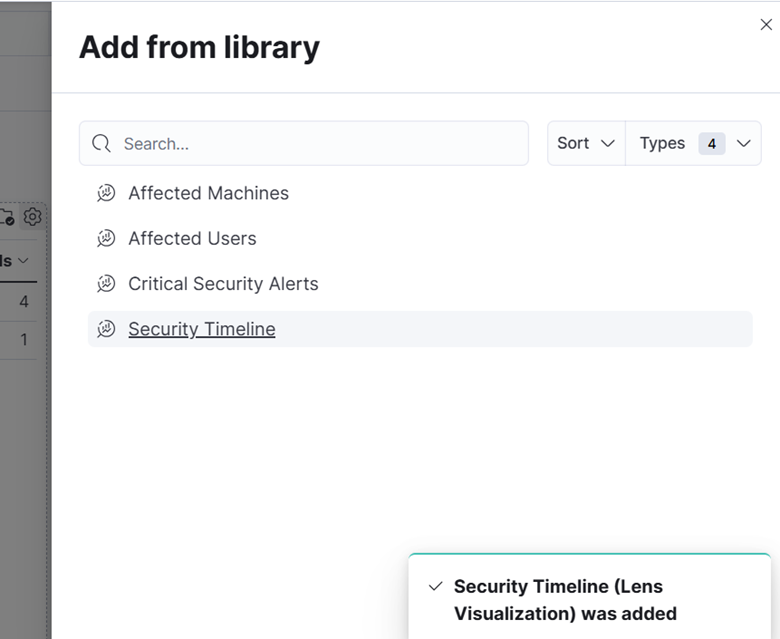
- Clique em “Biblioteca de Visualizações.”
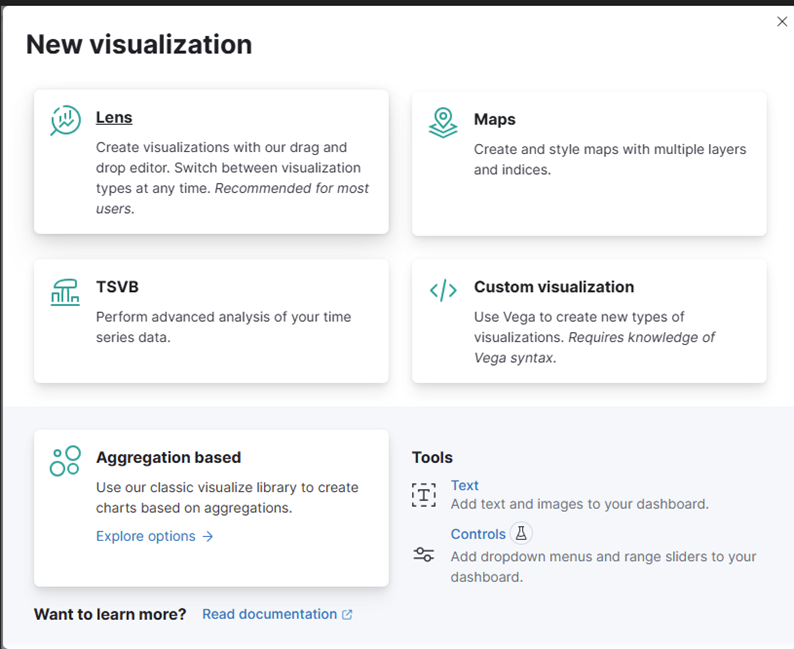
- Clique no bloco “Lens”.
- No menu suspenso, escolha “Métrica.”
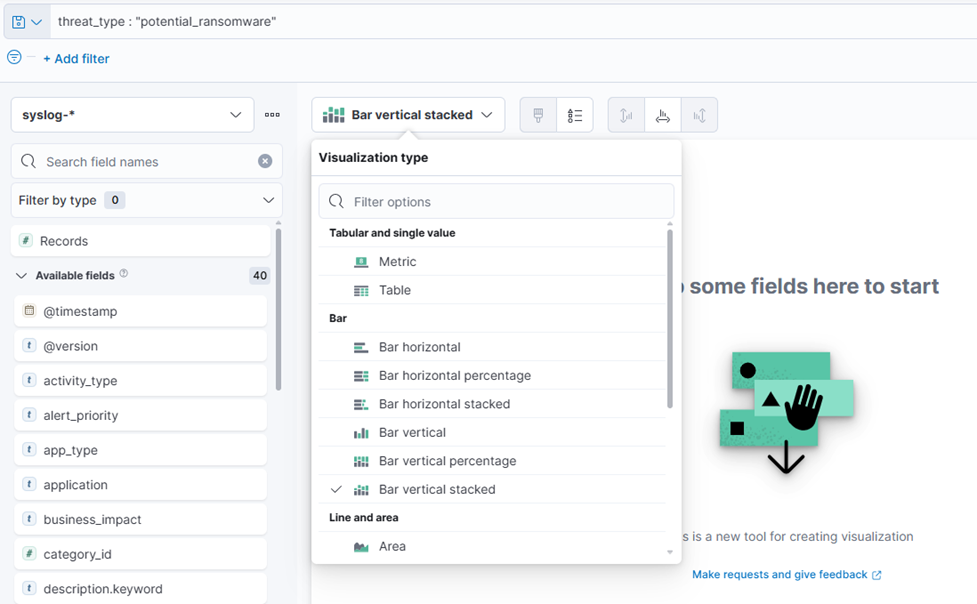
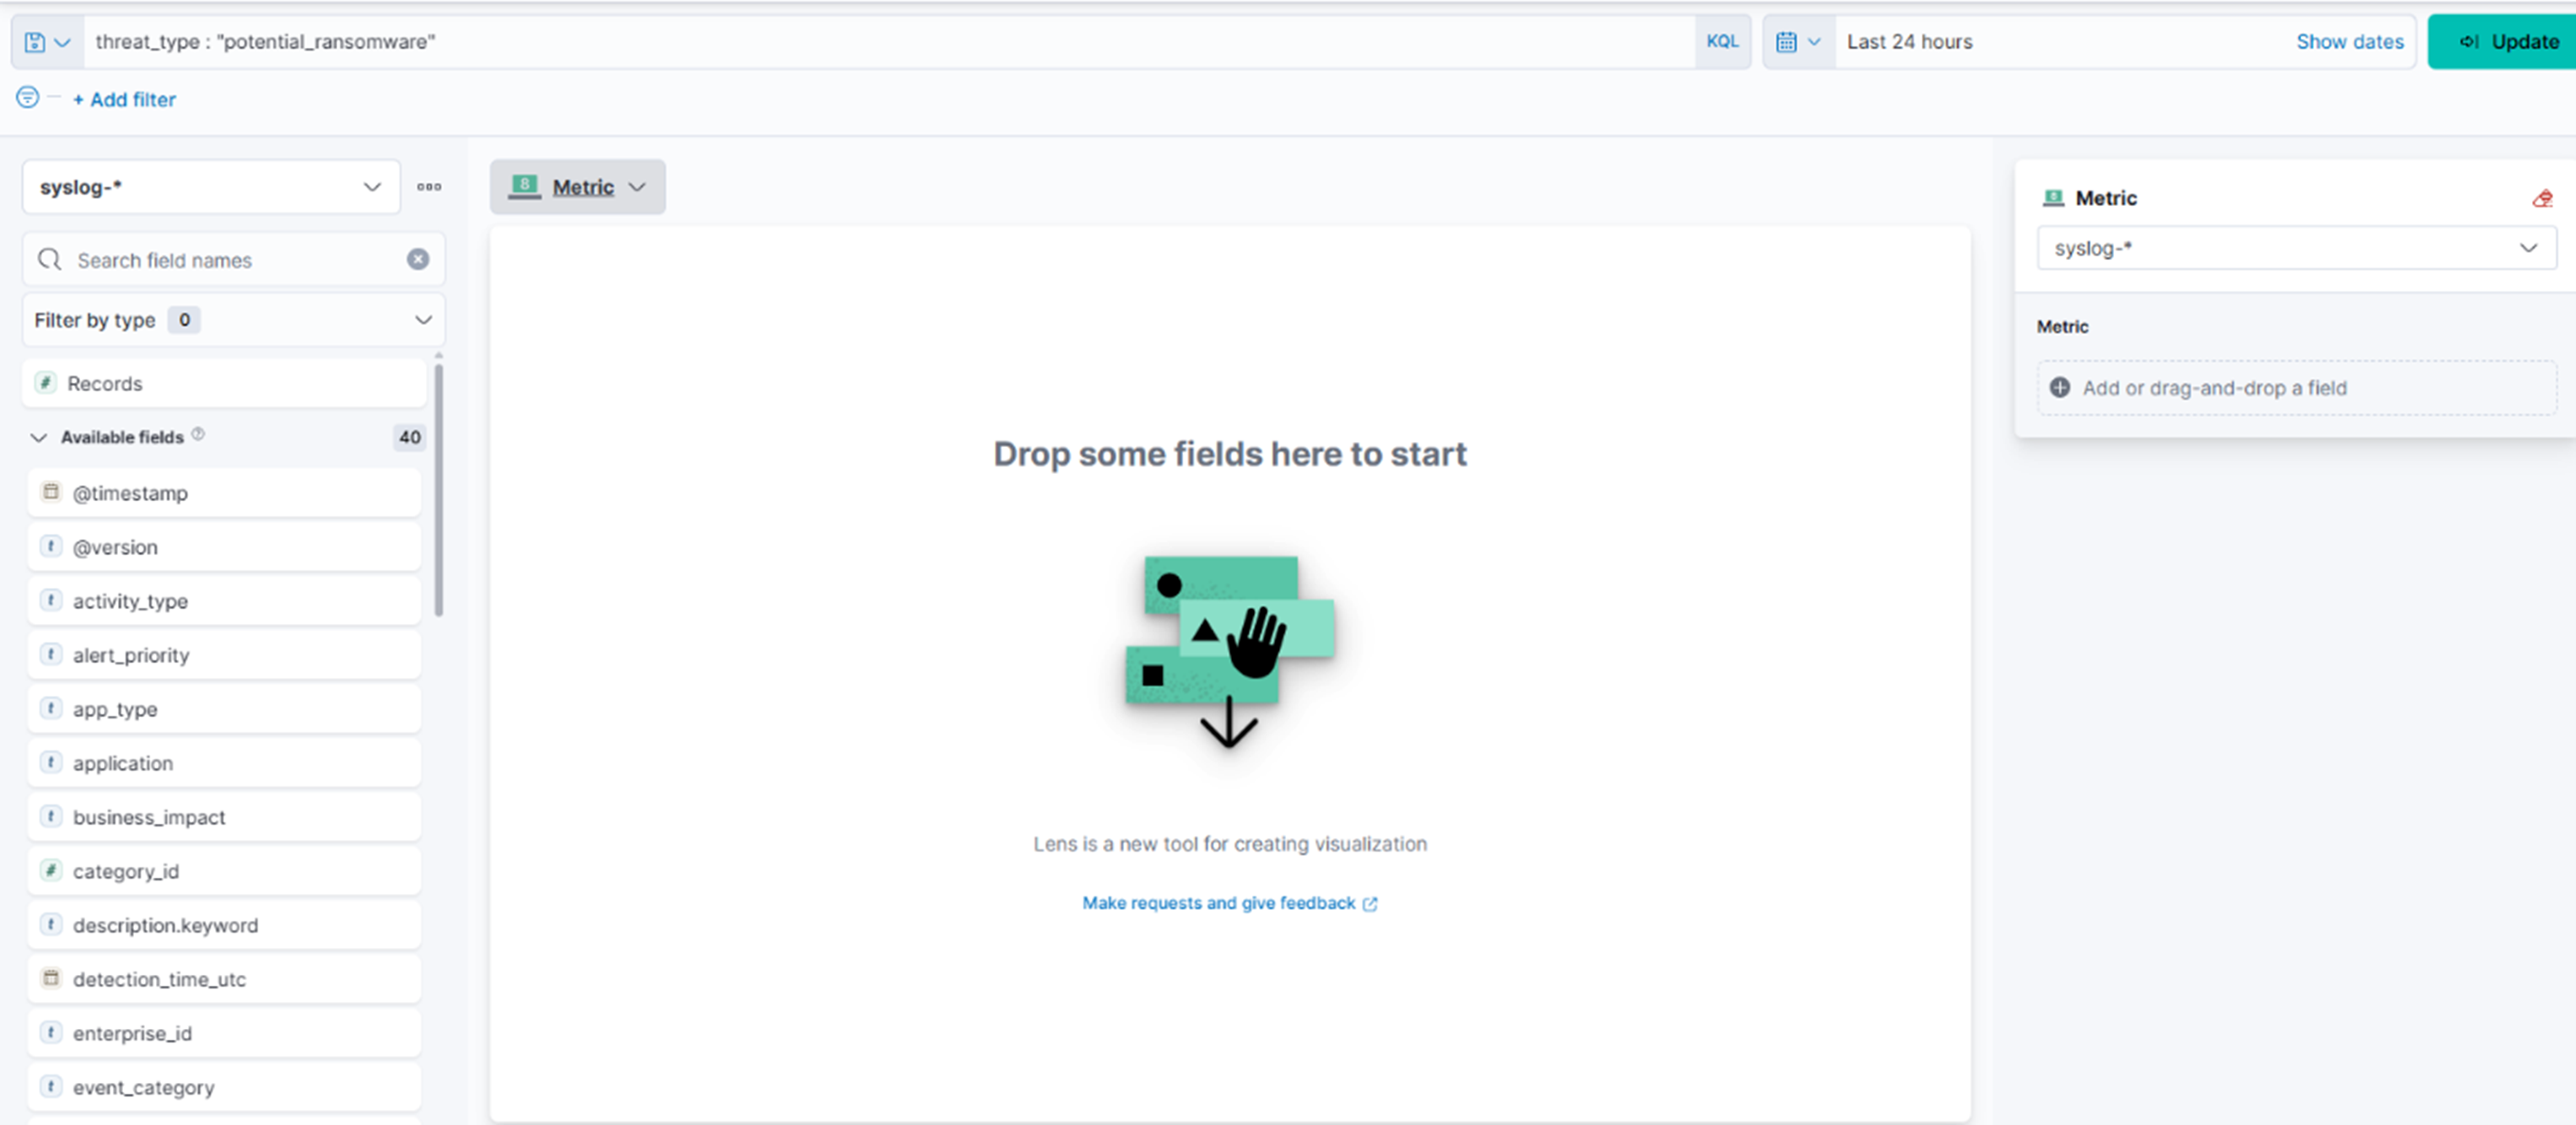
7. No campo de filtro, digite: threat_type: “potential_ransomware”
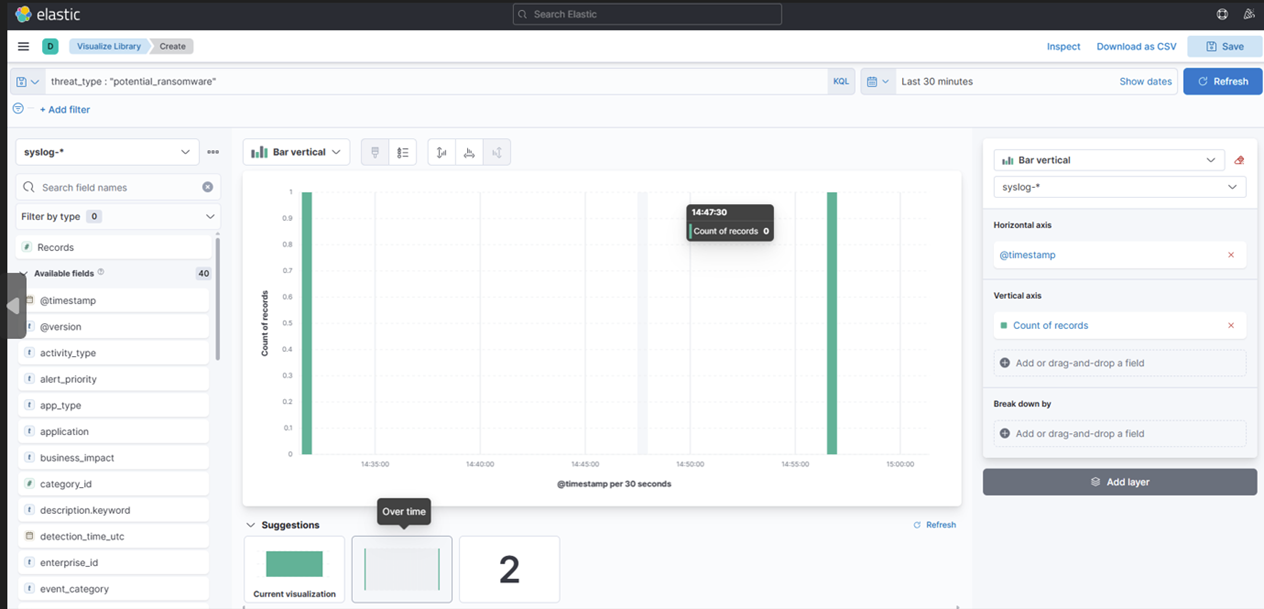
8. Escolha “Overtime” no meio (esta é sua escolha de como você quer que o painel pareça).
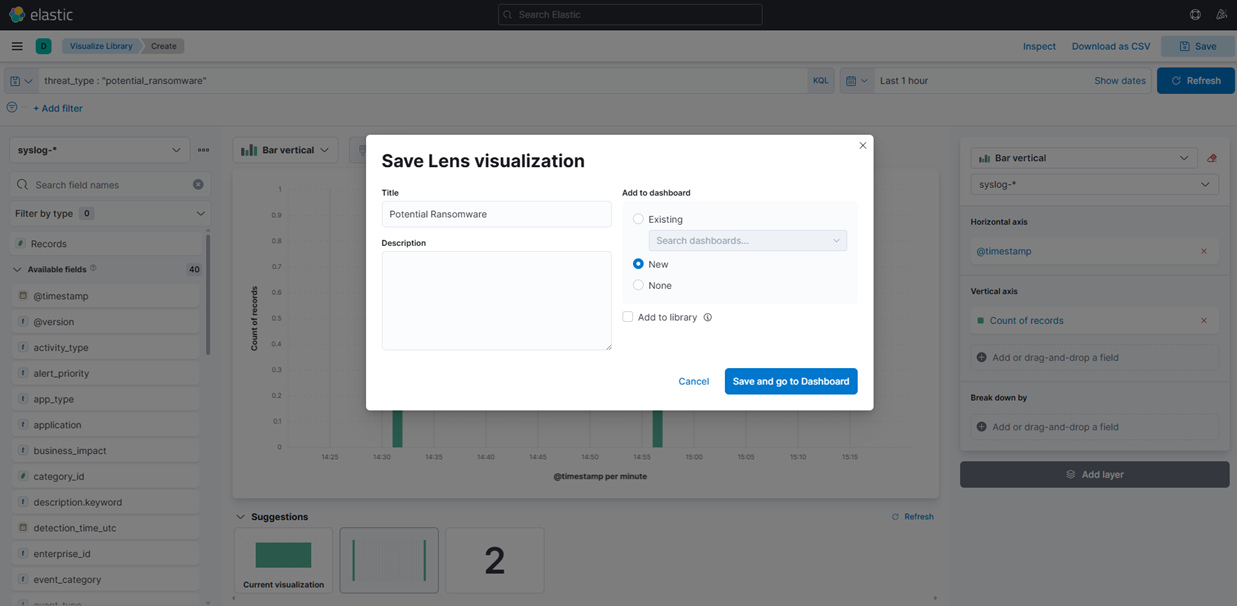
9. Salve a Visualização clicando no botão "Salvar” no canto superior direito e adicione a um novo Painel:
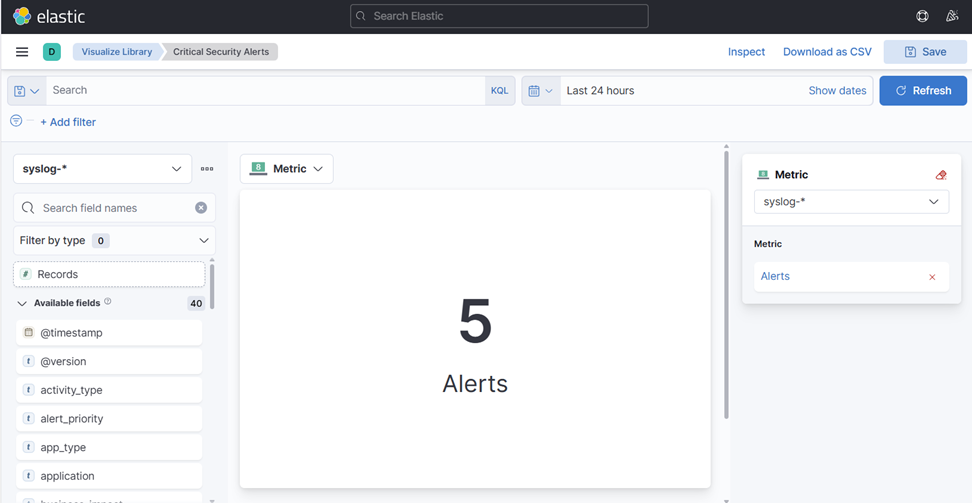
10. Altere o “Nome” sob Métricas para “Alertas” e escolha Registros à esquerda.
- Você deve acabar com isso:
11. Salve isso na sua Biblioteca de Visualizações e escolha “Sem Painel” por enquanto.
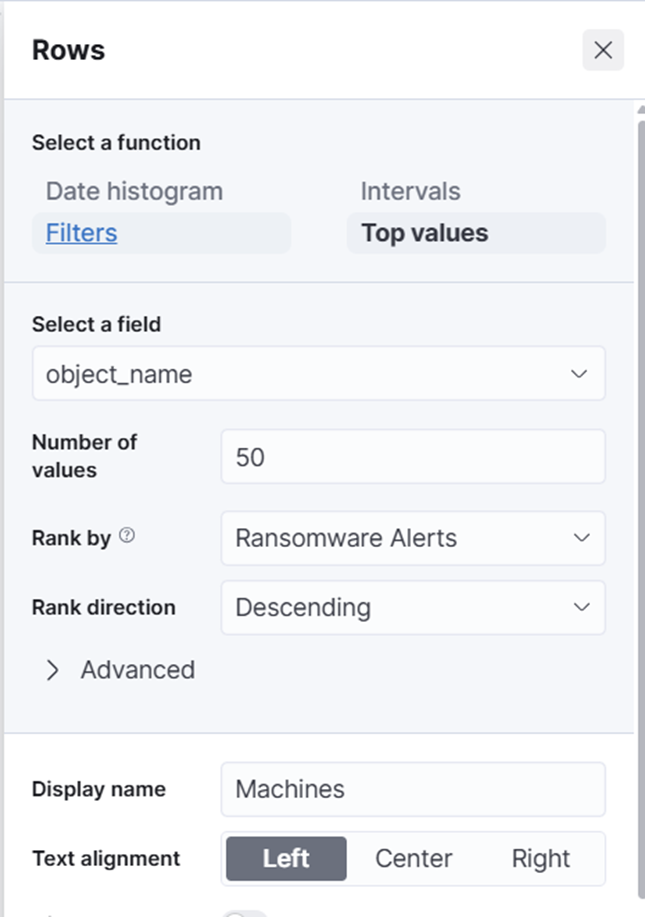
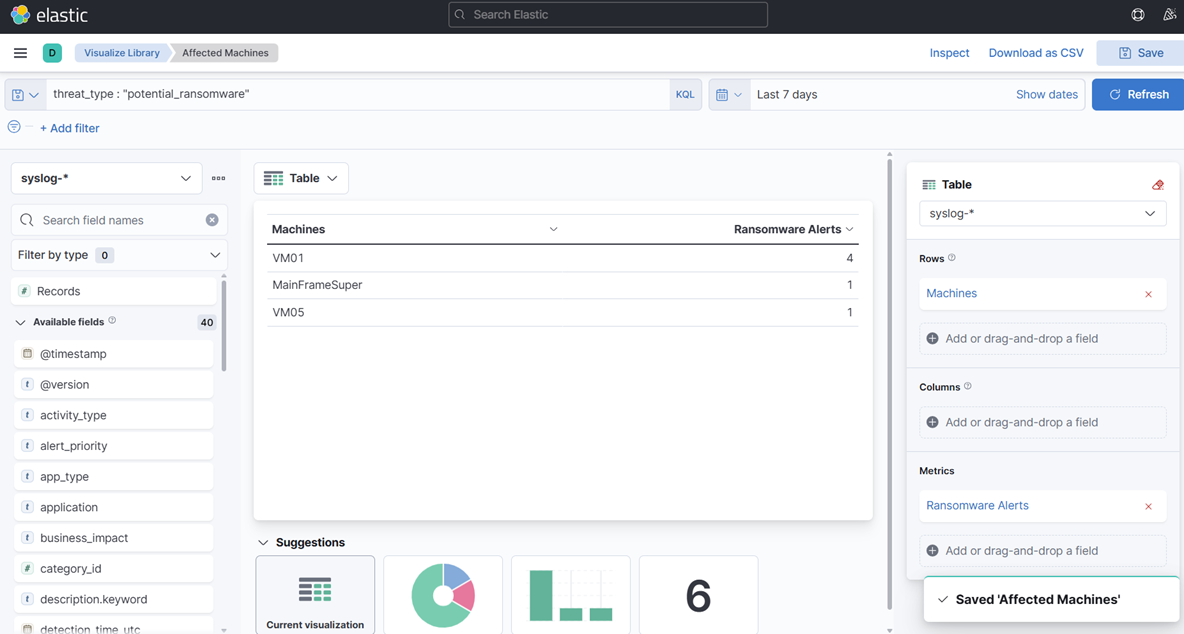
12. Em seguida, crie outra visualização que chamaremos de “Máquinas Afetadas.”
- Desta vez, escolha Tabela, não Métrica, e use o campo “Top values of object_name” e novamente registre. Altere os nomes das Colunas pressionando os nomes do lado direito e mudando o nome de Exibição:
13. Salve novamente na sua biblioteca.
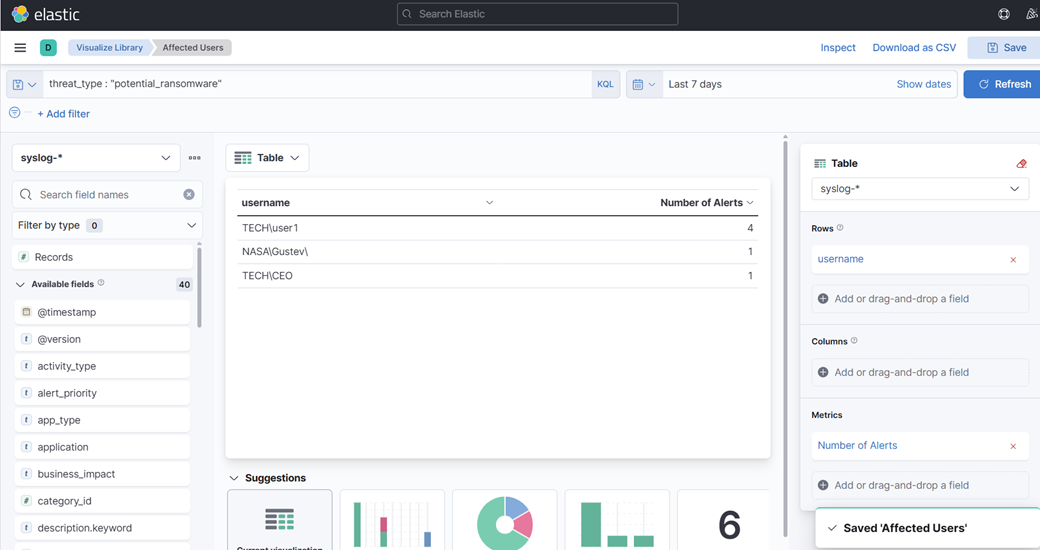
14. Agora, vamos criar outra visualização de tabela—desta vez usando o campo “Top Values of Username”. Isso pode ajudar a identificar quais usuários podem ter estado logados durante o ataque. Lembre-se, isso é puramente para fins exploratórios e demonstra como você pode aproveitar os dados de forma criativa.
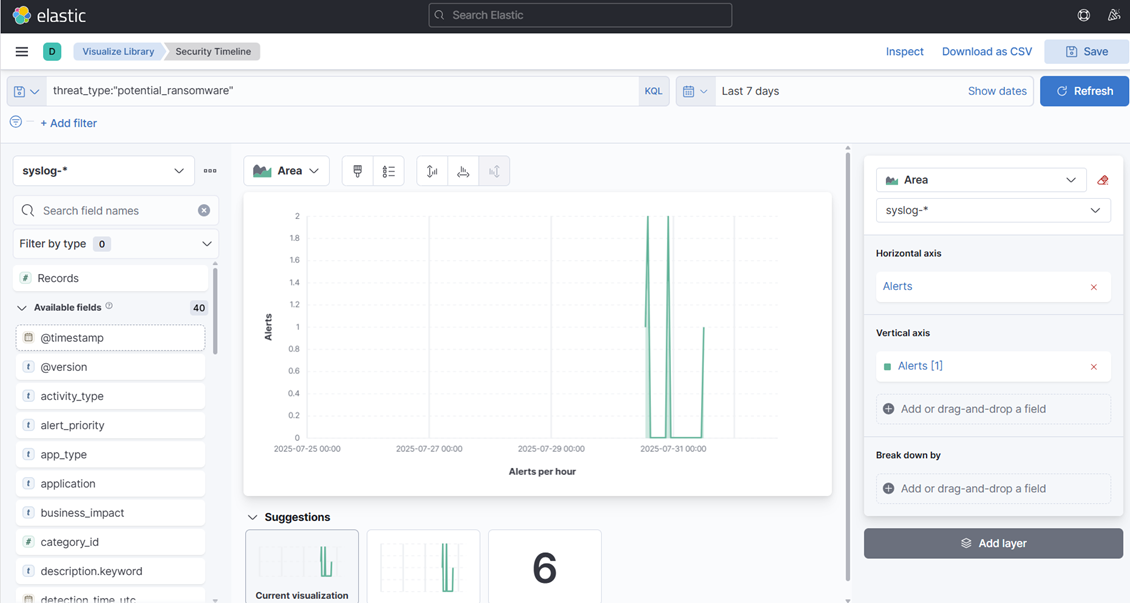
15. Finalmente, crie uma visualização de área—desta vez mostrando alertas e cronogramas.
16. Sinta-se à vontade para criar mais ou alterar as existentes para ter uma noção disso. Criamos algumas visualizações muito básicas apenas para explicar o processo.
17. Finalmente, crie um Painel e adicione essas visualizações.
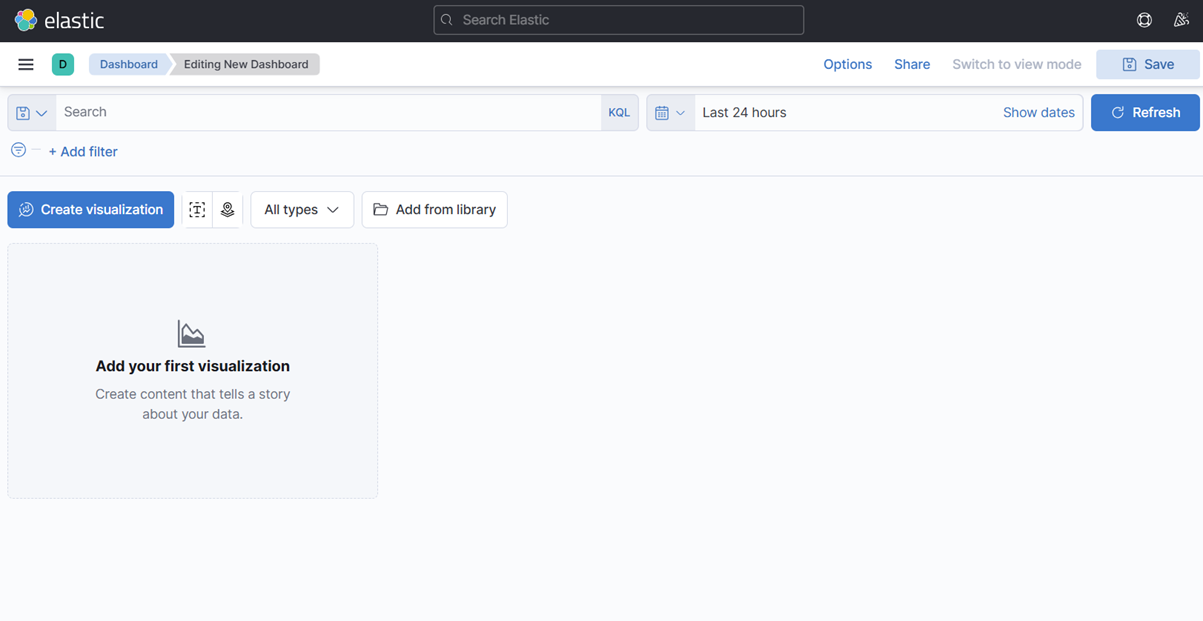
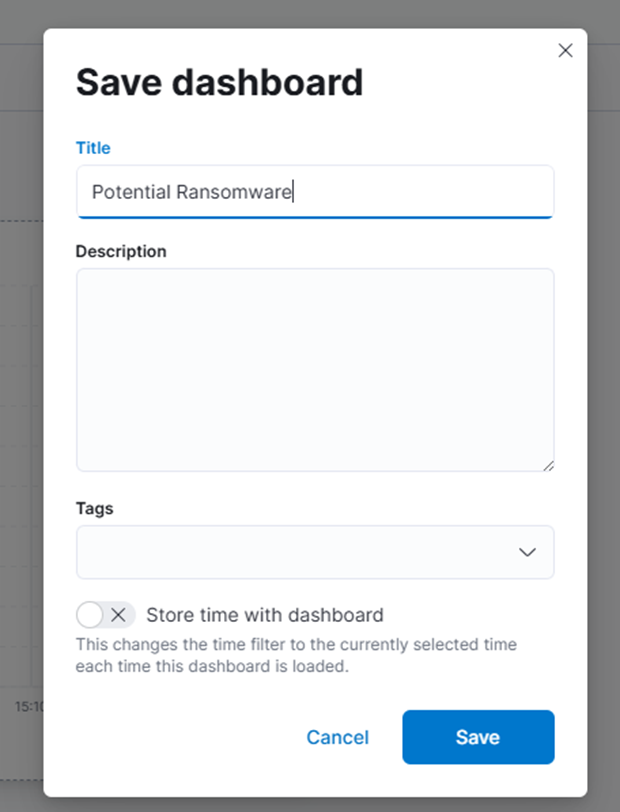
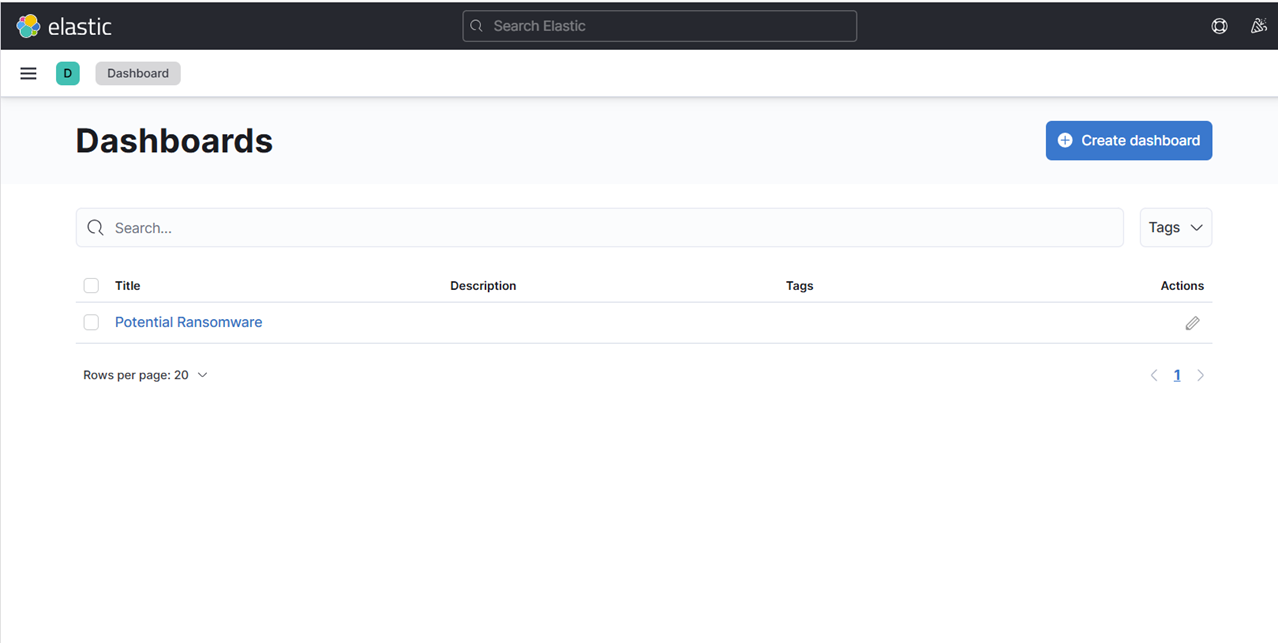
18. Salve o Painel com o nome “Potencial Ransomware.”
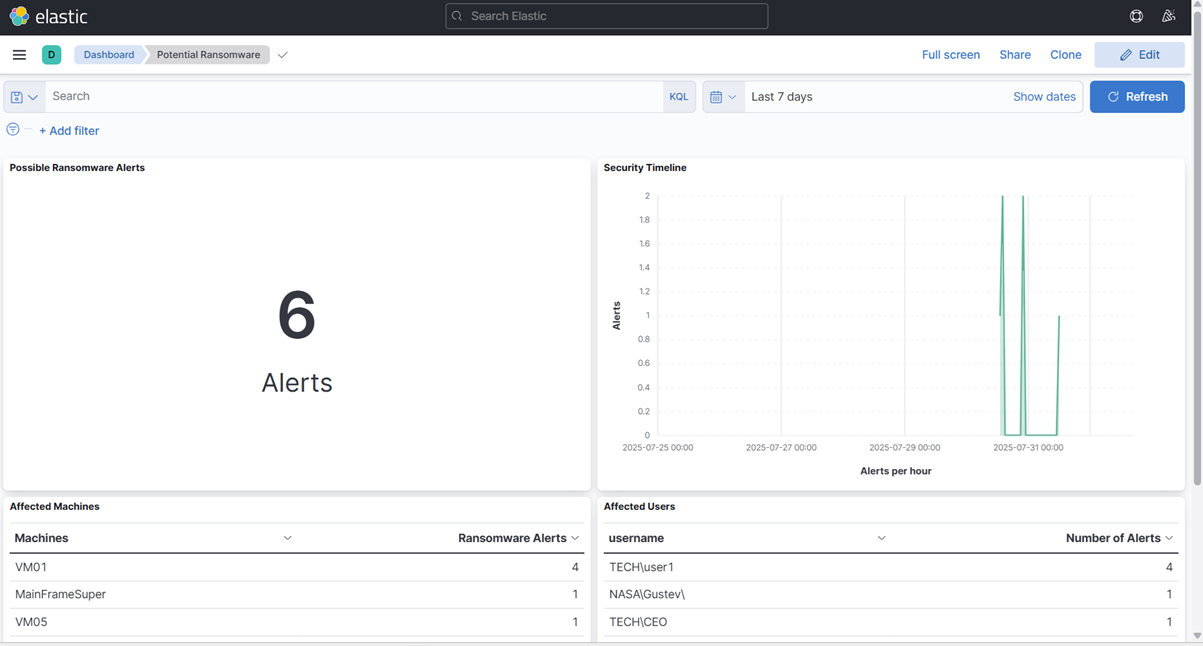
19. Para testar, vamos enviar outro alerta como se fosse de Veeam mas mudar alguns dos componentes da mensagem para que possamos ver se ele é ingerido corretamente.
20. Vamos mudar o nome de usuário para Gustev e a VM para MainFrameSuper.
echo '<14>1 2025-03-20T14:06:09.662307+02:00 VBRSRV01 Veeam_MP - - [origin enterpriseId="31023"] [categoryId=0 instanceId=41600 DetectionTimeUTC="03/20/2025 13:05:41" OibID="0e54d3bf-add8-48eb-9122-fad3ac1e8fb3" ActivityType="EncryptedData" UserName="NASA\Gustev\" ObjectName="MainFrameSuper" VbrHostName="vbrsrv01.tech.local" Description="Potential malware activity detected"]' | nc -u -q0 localhost 5514
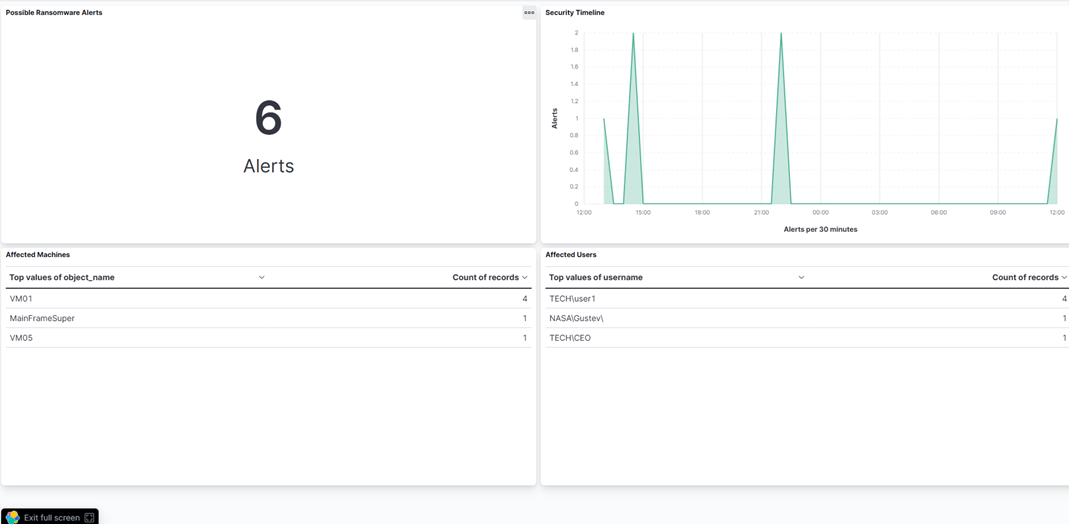
- Como podemos ver, nosso Painel nos alerta imediatamente ao receber a mensagem syslog:
Conclusão
Quando você começou esta série, enfrentou uma parede de texto críptico de 347 caracteres:
<14>1 2025-03-20T14:06:09.662307+02:00 VBRSRV01 Veeam_MP - - [origin enterpriseId="31023"] [categoryId=0 instanceId=41600 DetectionTimeUTC="03/20/2025 13:05:41" OibID="0e54d3bf-add8-48eb-9122-fad3ac1e8fb3" ActivityType="EncryptedData" UserName="TECH\user1" ObjectName="VM01" VbrHostName="vbrsrv01.tech.local" Description="Potential malware activity detected"]Agora, essa mesma mensagem aciona um sistema de monitoramento de segurança inteligente que identifica imediatamente:
- Tipo de Ameaça: Atividade potencial de ransomware
- Nível de Prioridade: Impacto crítico nos negócios
- Usuário Afetado: TECH\user1 (identificado como humano, não conta de serviço)
- Ativo Comprometido: Máquina virtual VM01
Neste blog, fornecemos aos leitores uma imagem mais clara do que precisa acontecer com uma mensagem syslog bruta antes que ela possa ser útil em um SIEM—especificamente dentro da pilha ELK. Desde a análise até o enriquecimento, detalhamos os passos essenciais que transformam logs barulhentos em insights acionáveis.
Na próxima e última parte de nossa mini série de blogs sobre SIEM Elasticsearch, abordaremos brevemente o uso do Fluentd em vez do Logstash e tocaremos no Elastic Security.